


By Ricardo J. Sánchez
Introduction
In the year 2000, the container port industry in the Americas mobilised 40.8 million TEUs; with the same regional sample, it reached 136.8 million in 2025, equivalent to 3.3 times the initial level. The global series goes from 226 million TEUs in 2000 (Clarksons Research, 2003) to 1,012.5 million in 2025 (DynaLiners, 2026). With these values, the participation of the sample of the Americas in the world total decreases from 18% to 13.5%. Latin America and the Caribbean, considered together, register an average participation of 6.92% in the period, with a population standard deviation of 0.20 percentage points (7.3% in 2025).
Even though that growth trajectory was not linear, it maintained a notorious momentum for the first 15 years, facing strong ups and downs afterwards related to intrinsic changes and to the general economic environment that the ports serve. The present article provides summary evidence of the trajectory of the container port industry in the Americas, between 2000 and 2025.
Two central products of the study are the 2025 port ranking and the “Th/GDP Multiplier – relative index of port movement/GDP”. The first orders ports and port complexes according to their total container movement; the second compares the evolution of port movement and real GDP in countries and regions, without necessarily constituting a causal estimate.
This study comprises, as a geographical area of reference, the container port system of the American continent, North, Central and South, as well as the whole of the Caribbean basin, including both the island and coastal territories of the Caribbean Sea, which allows the use of the name “America”, which is a term with varied meanings depending on whether it is looked at from the geographical, cultural or geopolitical point of view. For this reason, before specifying this delimitation, it is necessary to clarify the regional terminology used, since the available categories are not synonymous or mutually exclusive, and their indiscriminate use may lead to errors of interpretation.
In this study, the term “America” is used as a designative of the entire continent, which contains the classic Spanish-American meaning (North, Central and South, plus the entire Caribbean). To avoid ambiguities, and following academic and diplomatic convention, the formula “the Americas” is used to refer to the continental whole. However, neither “America” nor “the Americas” alone resolve the belonging of the insular Caribbean, whose inclusion usually requires explicit mention, as in the composite formula “Latin America and the Caribbean” (LAC) adopted by the United Nations.
A second category, “Western Hemisphere”, has geopolitical connotations and, although it unambiguously includes all of America and the Caribbean, it can carry with it hegemonic and racial biases identified in diplomatic historiography (e.g., Whitaker, 1954 and Schoultz, 1998).
A third category, “Latin America”, responds to a linguistic-cultural criterion (Iberian heritage) and not a geographical one, highlighting the paradigmatic case of Mexico: it belongs geographically to North America, but is culturally and linguistically categorised as a Latin American country. This dual belonging is not only academic but also operative in institutional classifications: Braig and Baur (2005) document that the Pentagon’s Northern Command (in 2002) grouped Mexico together with the United States and Canada for continental security reasons, administratively separating it from the rest of Latin America, while regional organisations of a different nature (ECLAC, IDB) keep it within “Latin America” (ECLAC, 1992).
The Caribbean’s relationship with “Latin America” requires distinguishing geographical, linguistic, and institutional boundaries. Hoffmann (2025) warns that the non-Spanish-speaking Caribbean remains underrepresented in Latin American studies, even when they nominally incorporate the Caribbean. For his part, Pantojas García (2011) examines the diversity and fragmentation of the region. These contributions justify making explicit the groupings used, rather than treating regional denominations as interchangeable.
For these reasons, the present study opts for an explicitly operational definition and not for any of the inherited categories: “America and the Caribbean basin” is understood to mean all the ports located in the American continent (North, Central and South) plus all the island and coastal ports of the Caribbean Sea, regardless of their languages, political status or membership of pre-existing regional integration schemes.
The case study of Bermuda requires a differentiated approach. It is located in the North Atlantic, outside the Caribbean Sea and its geographical basin; Williams and Bunkley-Williams (2021) distinguish this physical criterion from broader regional delimitations, such as those discussed by Spalding (2004). In the M49 statistical classification, Bermuda belongs to Northern America (021), while Caribbean (029) is part of Latin America and the Caribbean (419), within the Americas (019) (United Nations, n.d.). Therefore, Northern America should not be confused with other geographical meanings of North America. Bermuda’s status as an associate member of CARICOM since 2003 constitutes an institutional link, not a membership of the Caribbean geographical basin (CARICOM, 2003). In any case, some references to Bermuda have been maintained in this study.
The scope of port activity in study
The study reviews the evolution of the most important ports in the area defined above, with activity in the container sector, with annual throughput data between 2000 and 2025. Although strictly speaking, the millennium began on January 1, 2001, the year 2000 is included as a reference. In addition, to avoid the discomfort of long series, the criterion of considering periods of 5 years was adopted, with which data from 2000, 2005, 2010, 2015, and from 2019 onwards are presented on an annual basis. 2019 is included as it is the reference year before the pandemic.
The draft identifies a sample of 155 ports and port complexes in countries and territories of the study area, which contain approximately 272 specialised or multipurpose terminals that have containers as their central activity. This is not an exhaustive census, but rather its percentage coverage with respect to the regional universe requires a complete base of non-overlapping units and a comparable regional total; therefore, a percentage of coverage that is not reproducible with the available tables is not attributed here, although it is estimated that it exceeds 90%.
Port activity as a derived demand
The demand for port services is a derivative demand: it responds to the need to move goods between places of production, consumption, processing or transshipment. Notteboom et al. (2022) situate this relationship within the framework of trade and logistics chains. This does not exclude the economic effects of port activity on other sectors. Chang et al. (2014) analyse precisely these effects in South Africa using an input-output model; their study should not be presented as an estimate of the response of port movement to changes in GDP.
This feature justifies the inclusion the GDP of the economies studied in methodological terms: if container traffic is demand derived from trade and production, the evolution of GDP constitutes a fundamental macroeconomic determinant to understand the fluctuations of port throughput throughout the period.
Economic activity in the period: growth trajectories by region
The tables below present compound annual growth rates (CAGRs) of GDP, calculated from the World Bank’s 2015 constant dollar series. Normalising levels with 2015 = 100 is a different presentation choice from the constant price year: a common rescaling of the series does not alter its growth rates. For an interval of n years, CAGR = [(final GDP / initial GDP) ^ (1/n) – 1] × 100. The windows based on 2015 cover 4 to 10 years; those ending in 2025 and beginning in 2010, 2005 and 2000 cover 15, 20 and 25 years, respectively.
The case of South America
| 2019/ 2015 | 2020/ 2015 | 2021/ 2015 | 2022/ 2015 | 2023/ 2015 | 2024/ 2015 | 2025/ 2015 | 2025/ 2010 | 2025/ 2005 | 2025/ 2000 | |
| Argentina | -1.0% | -2.8% | -0.7% | 0.2% | -0.1% | -0.2% | 0.2% | 0.7% | 1.7% | 1.7% |
| Bolivia | 3.2% | -0.2% | 1.4% | 1.8% | 1.9% | 1.5% | 1.2% | 2.6% | 3.1% | 3.1% |
| Brazil | 0.2% | -0.5% | 0.4% | 0.8% | 1.1% | 1.3% | 1.4% | 1.3% | 2.1% | 2.3% |
| Chile | 1.9% | 0.3% | 2.0% | 2.0% | 1.9% | 2.0% | 2.0% | 2.6% | 3.0% | 3.3% |
| Colombia | 2.3% | 0.3% | 2.0% | 2.7% | 2.5% | 2.4% | 2.4% | 3.2% | 3.5% | 3.5% |
| Ecuador | 1.6% | -0.7% | 0.9% | 1.6% | 1.7% | 1.2% | 1.5% | 2.7% | 2.9% | 3.3% |
| Guyana | 4.3% | 11.2% | 12.6% | 18.8% | 20.6% | 22.9% | 22.6% | 15.8% | 12.8% | 10.2% |
| Peru | 3.2% | 0.2% | 2.3% | 2.4% | 2.0% | 2.2% | 2.3% | 3.1% | 4.0% | 4.1% |
| Paraguay | 2.9% | 2.2% | 2.5% | 2.1% | 2.5% | 2.7% | 3.1% | 3.4% | 3.9% | 3.5% |
| Suriname | 0.6% | -2.9% | -2.9% | -2.1% | -1.6% | -1.2% | -0.9% | -0.1% | 1.1% | 1.9% |
| Uruguay | 1.1% | -0.6% | 0.4% | 1.0% | 1.0% | 1.2% | 1.3% | 2.0% | 3.0% | 2.4% |
| Venezuela | -20% | -22% | -19% | -15% | -13% | -11% | -10% | -6.8% | -4.3% | -2.9% |
| South America | 0.1% | -1.2% | 0.2% | 0.7% | 0.9% | 1.1% | 1.2% | 1.5% | 2.3% | 2.4% |
| Latin America and the Caribbean | 0.6% | -0.9% | 0.3% | 0.9% | 1.0% | 1.2% | 1.3% | 1.6% | 2.1% | 2.2% |
| Total World | 3.1% | 1.8% | 2.6% | 2.7% | 2.7% | 2.8% | 2.8% | 2.9% | 2.9% | 2.9% |
Note: Values are compound annual growth rates (CAGRs). Latin America and the Caribbean includes Mexico. Source: author, based on World Bank data accessed 14 September 2026: (https://datos.bancomundial.org/indicator/NY.GDP.MKTP.KD).
Methodological note: The macroeconomic aggregate Latin America and the Caribbean includes both regions together and is not equivalent to the Latin America aggregate in the relative index table, which excludes the Caribbean. Nor should North America in the macroeconomic tables be automatically confused with USA+Canada in the charts and the index.
In the long horizon (2025/2000), South America registers a CAGR of 2.39%, slightly higher than that of Latin America and the Caribbean (2.19%) and lower than the global (2.92%). This gap widens when the window is shortened: 1.49% compared to 2.86% worldwide in 2025/2010, and 1.24% compared to 2.77% in 2025/2015. The gap with respect to the world goes from 0.53 to 1.53 percentage points when comparing the 25 and 10-year windows, respectively: it almost triples. This comparison is consistent with a lower relative dynamism in the last decade, although the windows overlap and do not constitute independent periods.
In 2025/2000, Guyana (10.22%), Peru (4.09%), Colombia (3.52%), Paraguay (3.51%), Chile (3.31%), Ecuador (3.29%) and Bolivia (3.10%) exceed the three references: South America (2.39%), Latin America and the Caribbean (2.19%) and World (2.92%). Venezuela (-2.95%), Argentina (1.74%) and Suriname (1.90%) are below the three. Brazil (2.26%) only exceeds the Latin America and the Caribbean benchmark; Uruguay (2.40%) exceeds this and, slightly, the South American one, but not the world one. Guyana registers the highest growth in the table and an index of 765.5 in 2025 (2015 = 100).
The most critical period is 2020/2015, the only window with a negative CAGR in the subregional aggregate (-1.18%), with a fall in the index from 100.3 in 2019 to 94.2 in 2020 and negative rates in seven out of twelve economies, clearly influenced by the effects of the pandemic. It is followed by 2019/2015, with a CAGR of 0.08%, which speaks of an indication of stagnation prior to the pandemic.
The impact of the pandemic is most clearly observed in the variation of 2020 compared to 2019. South America fell 6.06%, more than double the global contraction (2.89%), and Latin America and the Caribbean fell 6.86%. The largest falls corresponded to Venezuela (-29.82%), Suriname (-15.98%), Bolivia (-12.72%) and Peru (-10.93%); Paraguay is the least affected economy (-0.82%) and Guyana expands its product 43.48%. The recovery of 2021 was uneven: the subregion grew 7.37%, but Guyana, Chile, Colombia, Paraguay, Brazil and Peru exceeded their 2019 level, while Venezuela and Suriname remained 29.39% and 18.02% below.
The case of North America
| 2019/ 2015 | 2020/ 2015 | 2021/ 2015 | 2022/ 2015 | 2023/ 2015 | 2024/ 2015 | 2025/ 2015 | 2025/ 2010 | 2025/ 2005 | 2025/ 2000 | |
| Canada | 2.2% | 0.7% | 1.6% | 2.0% | 2.0% | 2.0% | 2.0% | 2.0% | 1.8% | 2.0% |
| USA | 2.5% | 1.5% | 2.3% | 2.3% | 2.4% | 2.4% | 2.4% | 2.4% | 2.0% | 2.1% |
| Mexico | 1.3% | -0.7% | 0.4% | 0.9% | 1.1% | 1.2% | 1.1% | 1.6% | 1.5% | 1.4% |
| North America | 2.4% | 1.3% | 2.1% | 2.2% | 2.3% | 2.3% | 2.3% | 2.3% | 2.0% | 2.1% |
Note: Values are compound annual growth rates (CAGRs). Latin America and the Caribbean includes Mexico. Source: author, based on World Bank data accessed 14 September 2026: (https://datos.bancomundial.org/indicator/NY.GDP.MKTP.KD).
In the long horizon (2025/2000) the subregion grows 2.08% annually, below both the world average (2.92%) and that of Latin America and the Caribbean (2.19%). The relative position is reversed in the short windows: in 2025/2015 it reaches 2.31%, compared to 1.28% in LAC and 2.77% worldwide. The internal composition is uneven. The US leads with 2.13% in the long horizon and 2.41% in 2025/2015, approaching the global pace. Canada registers 1.96% and 1.97%, respectively, with notable stability between windows. Mexico lags behind in all horizons: 1.45% in 2025/2000 and 1.10% in 2025/2015, the only one of the three economies below the LAC average in the ten-year window.
The 2020 shock was comparatively moderate in the aggregate (-2.64%) due to the US peso (-2.08%), but heterogeneous: Mexico fell 8.35% and Canada 5.04%. The recovery of 2021 (6.13%) returned the subregion 3.33% above 2019, although Mexico remained 2.81% below.
The case of Central America
| 2019/ 2015 | 2020/ 2015 | 2021/ 2015 | 2022/ 2015 | 2023/ 2015 | 2024/ 2015 | 2025/ 2015 | 2025/ 2010 | 2025/ 2005 | 2025/ 2000 | |
| Belize | 0.8% | -2.3% | 0.9% | 2.0% | 1.8% | 2.0% | 2.1% | 2.4% | 2.1% | 2.8% |
| Costa Rica | 3.5% | 1.9% | 2.9% | 3.3% | 3.5% | 3.5% | 3.6% | 3.7% | 4.0% | 4.0% |
| Guatemala | 3.3% | 2.3% | 3.2% | 3.3% | 3.4% | 3.4% | 3.5% | 3.6% | 3.6% | 3.5% |
| Honduras | 3.8% | 1.1% | 2.9% | 3.1% | 3.2% | 3.2% | 3.3% | 3.4% | 3.4% | 3.7% |
| Nicaragua | 0.7% | 0.1% | 1.7% | 2.0% | 2.3% | 2.4% | 2.7% | 3.6% | 3.4% | 3.3% |
| Panama | 4.3% | -0.5% | 2.1% | 3.3% | 3.8% | 3.7% | 3.8% | 5.0% | 5.8% | 5.6% |
| El Salvador | 2.4% | 0.3% | 2.1% | 2.2% | 2.4% | 2.4% | 2.5% | 2.6% | 2.3% | 2.2% |
| Central America | 3.4% | 1.1% | 2.6% | 3.1% | 3.3% | 3.3% | 3.4% | 3.8% | 4.0% | 3.9% |
Note: Values are compound annual growth rates (CAGRs). Latin America and the Caribbean includes Mexico. Source: author, based on World Bank data accessed 14 September 2026: (https://datos.bancomundial.org/indicator/NY.GDP.MKTP.KD).
It is the subregion with the best relative performance, with 3.89% annually in 2025/2000 and 3.43% in 2025/2015, in both cases exceeding the world average. Panama leads the long horizon (5.60%), followed by Costa Rica (3.98%), Honduras (3.66%), Guatemala (3.50%) and Nicaragua (3.33%). El Salvador (2.17%) and Belize (2.76%) are below the subregional average, but only Belize exceeds the Latin America and the Caribbean benchmark (2.19%); El Salvador is slightly below.
The pandemic hit harder than in North America: the aggregate fell 7.69% in 2020, with Panama (-17.82%) and Belize (-13.52%) at the extremes, compared to Guatemala (-1.79%) as the most resilient economy. The recovery was equally vigorous (10.92% in 2021), and by 2025 the subregion accumulated 22.60% above the 2019 level, the best record of the four subregions.
The case of the Caribbean basin
| 2019/ 2015 | 2020/ 2015 | 2021/ 2015 | 2022/ 2015 | 2023/ 2015 | 2024/ 2015 | 2025/ 2015 | 2025/ 2010 | 2025/ 2005 | 2025/ 2000 | |
| Aruba | 2.3% | -3.6% | -0.7% | 0.8% | 1.9% | 2.4% | 2.3% | 2.4% | 1.3% | 1.5% |
| Antigua & Barbuda | 4.2% | -0.9% | 0.5% | 1.6% | 1.9% | 2.0% | 2.3% | 1.8% | 1.4% | 1.7% |
| Bahamas | 0.9% | -3.7% | -0.4% | 1.1% | 1.4% | 1.6% | 1.5% | 1.3% | 0.9% | 1.1% |
| Bermudas | 0.7% | -0.9% | 0.0% | 0.9% | 1.3% | 1.4% | 1.3% | 0.1% | 0.0% | 0.5% |
| Barbados | 0.5% | -3.4% | -1.5% | 0.8% | 0.9% | 1.2% | 1.3% | 0.7% | 0.3% | 0.5% |
| Cuba | 1.1% | -1.4% | -1.0% | -0.6% | -0.8% | -0.8% | -0.6% | 0.5% | 1.7% | 2.4% |
| Curacao | -1.9% | -5.5% | -3.9% | -2.4% | -1.6% | -0.9% | -0.7% | -0.5% | -0.1% | -0.1% |
| Cayman Islds. | 3.7% | 1.9% | 2.4% | 2.8% | 3.2% | 3.3% | 3.0% | 2.6% | n.a. | n.a. |
| Dominica | 0.1% | -3.3% | -1.9% | -0.2% | 0.3% | 0.5% | 0.7% | 0.4% | 1.1% | 1.1% |
| Dominican Rep. | 5.7% | 2.8% | 4.6% | 4.7% | 4.4% | 4.4% | 4.2% | 4.5% | 4.8% | 4.5% |
| Grenada | 3.3% | -0.4% | 0.5% | 1.4% | 1.8% | 1.9% | 2.1% | 2.4% | 1.6% | 2.2% |
| Haiti | 1.1% | 0.2% | -0.2% | -0.4% | -0.6% | -1.0% | -1.2% | 0.2% | 0.6% | 0.7% |
| Jamaica | 2.3% | 0.1% | 1.0% | 1.8% | 1.9% | 1.6% | 1.5% | 1.2% | 0.8% | 1.0% |
| St Kitts & Nevis | 2.3% | -1.5% | -1.2% | 0.4% | 0.7% | 0.7% | 0.9% | 1.5% | 1.7% | 2.0% |
| St Lucia | 2.1% | -3.4% | -1.1% | 1.5% | 1.8% | 2.2% | 1.9% | 1.5% | 1.6% | 1.6% |
| Puerto Rico | -1.7% | -2.2% | -1.8% | -1.1% | -0.9% | -0.5% | -0.4% | -0.4% | -0.7% | 0.0% |
| Sint Maarten | -0.9% | -3.5% | -2.2% | -0.1% | 0.4% | 0.7% | 1.0% | 1.2% | n.a. | n.a. |
| Turks & Caicos | 20% | 6.8% | 10% | 10% | 11% | 10% | 9.6% | 7.8% | n.a. | n.a. |
| Trinidad & Tobago | -3.3% | -4.4% | -3.8% | -3.1% | -2.6% | -2.0% | -1.9% | -0.4% | 0.6% | 2.1% |
| St Vincent & the Grenadines | 2.4% | 1.0% | 1.2% | 1.5% | 1.9% | 2.2% | 2.3% | 2.0% | 1.7% | 2.2% |
| USVI | 1.4% | 0.8% | 1.3% | 0.9% | 0.9% | 0.9% | 0.9% | -1.6% | -1.1% | n.a. |
| Caribbean | 1.1% | -0.9% | 0.1% | 0.6% | 0.7% | 0.8% | 0.8% | 1.1% | 1.4% | 1.8% |
Note: “n.a.” indicates absence of data in the source for the base year of the corresponding window, which prevents the calculation of the CAGR. The values correspond to compound annual growth rates (CAGR). Source: author, based on World Bank data accessed 14 September 2026: (https://datos.bancomundial.org/indicator/NY.GDP.MKTP.KD).
Considering the largest economies, the Caribbean presents the weakest trajectory: 1.84% annually in 2025/2000 and only 0.85% in 2025/2015, well below the world and LAC average. The Dominican Republic is the exception, with 4.52% and 4.19% in those windows, the only case that consistently exceeds both references. Jamaica (0.99%), Puerto Rico (0.00%) and Cuba (2.36% in the long horizon but -0.62% in 2025/2015) show stagnation or regression. Trinidad & Tobago registers 2.08% in 2025/2000 but -1.90% in 2025/2015.
The most critical period is 2020, with an aggregate contraction of 8.55%, the largest among the four subregions: Bahamas fell 20.09%, Barbados 17.41% and Cuba 10.95%. The recovery was the slowest (4.96% in 2021), and by 2025 the aggregate accumulated only 4.05% over 2019, compared to 22.60% in Central America and 14.41% in North America. Cuba (-10.07%) and Trinidad & Tobago (-5.75%) remained below their pre-pandemic level.
Container port activity in the Americas, 2000-2025
The port movement of containers in the Americas went from 40.8 million TEUs in 2000 to 136.8 million in 2025, which is equivalent to an expansion factor of 3.3 and a compound annual growth rate of close to 4.86% in the entire period (own elaboration based on information from the Kühne Chair of Logistics of the Universidad de los Andes, ECLAC, UNCTAD and DynaLiners).
This aggregate rate is broken down into two clearly differentiated sections: between 2000 and 2015 growth was 5.89% per year on average, while between 2015 and 2025 it moderated to 3.32%. A joint reading of Graph 1 and Graph 2 allows us to order three observations. First, the continental sample grows at a consistent rate but lower than the global rate (6.18% per year between 2000 and 2025), which translates into a sustained loss of relative participation. Second, Latin America and the Caribbean is growing faster than the continental (6.36% per year over the same horizon) due to the larger starting base of USA+Canada and the late maturation of regional containerisation. Third, the trajectory shows two clear inflections: the contraction of 2020, associated with the pandemic, and the setback of 2023, especially marked in the aggregate of the US and Canada.
In absolute terms, the Americas as a whole went from 40.8 million TEUs in 2000 to 96.2 million in 2015 and 136.8 million in 2025. USA+Canada grew from 25.6 to 63.1 million TEUs in the same period (CAGR of 3.7% per year between 2000 and 2025), while Latin America and the Caribbean went from 15.3 to 73.7 million TEUs (CAGR of 6.4%). These figures explain why the share of LAC within the world total remains practically stable at around 6.8%-7.3%: the Latin American and Caribbean subregion accompanies, with ups and downs, global growth, while the whole loses relative weight at the expense of other regions, particularly Asia (Sanchez et al., 2016 and Notteboom et al., 2022).
Figure 1. Annual throughput, selected years, by region and world (thousands of teu)
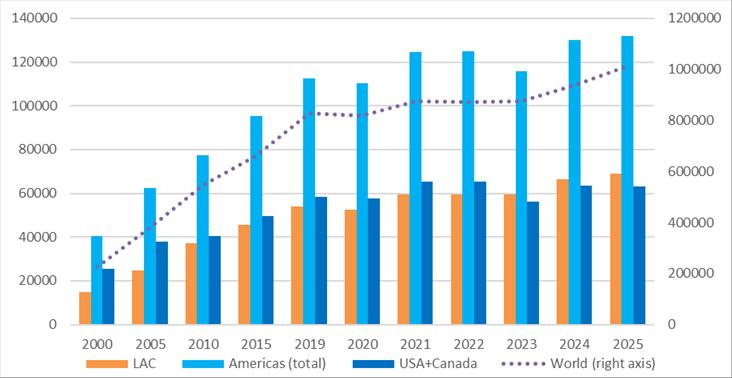
Source: the author based on data from the Kühne Professorial Chair in Logistics, Universidad de los Andes (Colombia), COCATRAM, ECLAC and UNCTAD. Note: The “LAC” label in this graph corresponds to Latin America and the Caribbean together.
Figure 2. Share of regions in annual world total (in %)
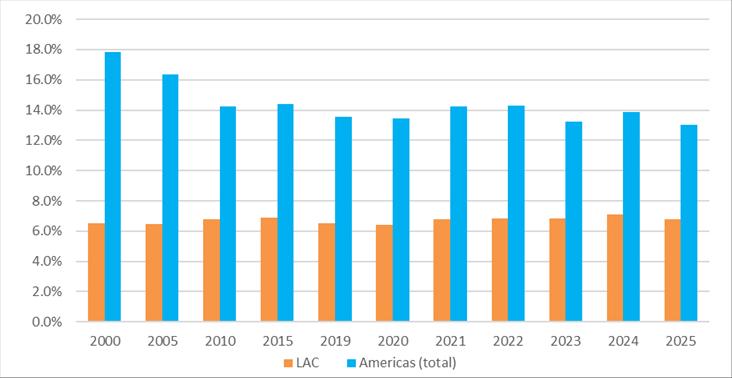
Source: the author based on data from the Kühne Professorial Chair in Logistics, Universidad de los Andes (Colombia), COCATRAM, ECLAC and UNCTAD. Note: LAC corresponds to Latin America and the Caribbean jointly.
The 2020-2021 biennium synthesises the fragility and resilience of the system. In 2020, the movement of the Americas as a whole contracted 1.7% compared to 2019, with falls of 1.00% in the USA+Canada and 2.4% in Latin America and the Caribbean, figures lower than the GDP contractions reported in the previous sections. In 2021, activity rebounded strongly and exceeded pre-pandemic levels; the expansionary phase lasted until 2022. In 2023, there was a correction of considerable magnitude: the Americas as a whole fell 7.2% compared to 2022, with a particularly pronounced drop in USA+Canada (14%), consistent with the adjustment of inventories and the normalisation of demand following the logistics imbalances of 2021-2022. In 2024 and 2025, activity recovered again. In the 2025/2019 balance, the continental set accumulates an increase of 17.4%, with disparate performances: 27.4% in Latin America and the Caribbean and 8.2% in the USA and Canada combined, compared to 22.3% of the world total.
The relative share of the Americas in global container movement falls from 18% in 2000 to 13.5% in 2025, with a minimum of 13.2% in 2023. The Latin American and Caribbean subregion, on the other hand, maintains a stable share in the range of 6.8%-7.3%. The combination of both facts confirms that the shift of the center of gravity of the container industry towards Asia, widely documented in the literature (Notteboom et al., 2022), is manifested in the Americas mainly by the loss of relative weight of USA+Canada and not by a weakening of Latin American and Caribbean containerisation.
Port rankings
The 2025 ranking by container movement presents a synthetic view of the port structure of the region. Before discussing the tables that follow, it is worth noting three reading criteria. Firstly, the ranking is built on the basis of ports and complexes, that is, administrative groupings of terminals that operate as a functional unit; this makes it possible to compare heterogeneous realities (a port with multiple terminals versus another with a single one) without bias by the mode of organisation. In the second place, complexes and their terminals should not be added to the same table, as they would double the movement; the list presents the aggregated unit when it best reflects the operational dimension. And in the third place, the provisional data for 2025, signaled with an asterisk, corresponds to internal estimates when the official figure was not yet available at the time of closing this version.
The following charts classify ports and port complexes ordered according to the 2025 container movement, expressed in TEUs. The aggregated units should not be added with their components. The delimitations used in the draft are as follows:
- Panama Caribbean: includes Bocas, CCT, Cristobal and MIT.
- Santos complex, Brazil: all terminals, including DPW.
- Cartagena Bay, Colombia: includes Contecar and SPRC.
- Panama Pacific: includes Balboa and Rodman/PSA.
- El Callao, Peru: Includes all terminals in El Callao, but not Chancay.
- Guayaquil, Ecuador: groups all its terminals.
- Buenos Aires, Argentina: includes the AMBA terminals: Dock Sud and Puerto Nuevo.
- Itajai, Brazil: includes Portonave Terminais Portuarios de Navegantes.
- Manaus, Brazil: includes Chibatao Navegação e Comercio, J. F. de Oliveira Manaus, Itacal, Porto Chibatao and Super Terminais Trade & Industry.
- Kingstown, SVG: includes Kingstown and Campden Park Container Port.
Top 60 – The Americas in 2025
| # | Ports | TEU | # | Ports | TEU | ||
| 1 | Los Angeles, CA, USA | 10,200,000 | * | 31 | San Juan, PR | 1,282,585 | * |
| 2 | Long Beach, CA, USA | 9,881,595 | 32 | Freeport, Bahamas | 1,262,500 | * | |
| 3 | New York-New Jersey, USA | 8,890,000 | * | 33 | Port Everglades, FL, USA | 1,167,552 | |
| 4 | Panama Caribbean | 5,883,942 | 34 | Miami, FL, USA | 1,115,058 | ||
| 5 | Santos complex, Brazil | 5,804,380 | 35 | Rio de Janeiro+Niteroi, Bra | 1,114,949 | ||
| 6 | Savannah, GA, USA | 5,703,287 | 36 | Rio Grande, Brazil | 1,038,468 | ||
| 7 | Houston, TX, USA | 4,303,345 | 37 | Manaus, Brazil | 1,017,910 | ||
| 8 | Bahia de Cartagena, Col. | 4,143,321 | 38 | Altamira+Tampico, MX | 923,913 | ||
| 9 | Panama Pacific | 4,031,509 | 39 | Philadelphia, PA, USA | 889,268 | ||
| 10 | Manzanillo, Mexico | 3,893,355 | 40 | Valparaiso, Chile | 887,972 | ||
| 11 | Vancouver, Canada | 3,778,996 | 41 | Prince Rupert, Canada | 885,796 | ||
| 12 | Virginia, VA, USA | 3,611,600 | 42 | Montevideo, ROU | 857,022 | ||
| 13 | El Callao | 3,323,408 | 43 | Puerto Cortes, Honduras | 794,669 | ||
| 14 | Seattle+Tacoma, USA | 3,074,530 | 44 | Puerto Quetzal, Gua. | 791,972 | ||
| 15 | Guayaquil, Ecuador | 2,858,019 | 45 | Pecem, Fortaleza, Brazil | 779,222 | ||
| 16 | Kingston, Jamaica | 2,661,456 | 46 | Suape, Recife, Brazil | 710,775 | ||
| 17 | Lazaro Cardenas, Mexico | 2,616,770 | 47 | Baltimore, MD, USA | 703,370 | ||
| 18 | Charleston, SC, USA | 2,600,000 | * | 48 | StoTomas de Cast., Gua. | 703,047 | |
| 19 | Oakland, CA, USA | 2,253,976 | 49 | Coronel, Chile | 659,607 | * | |
| 20 | Buenos Aires, Argentina | 2,090,289 | 50 | Puerto Barrios, Gua. | 624,831 | ||
| 21 | San Antonio, Chile | 2,058,540 | 51 | Talcahuano-San Vte, Ch | 580,058 | ||
| 22 | Buenaventura, Colombia | 1,700,363 | 52 | Rio Haina, Dom. Rep. | 528,019 | ||
| 23 | Caucedo, Dom. Rep. | 1,683,436 | 53 | Halifax, Canada | 502,000 | ||
| 24 | Paranagua, Brazil | 1,573,933 | 54 | Ensenada, Mexico | 454,700 | ||
| 25 | Montreal, Canada | 1,517,348 | 55 | Salvador, Bahia, Brazil | 443,412 | ||
| 26 | Sao Francisco do Sul+Itapoa, Bra | 1,488,816 | 56 | Iquique, Chile | 419,915 | ||
| 27 | Itajai, Brazil | 1,431,610 | 57 | Paita, Peru | 414,637 | ||
| 28 | Limon-Moin complex, CR | 1,391,829 | 58 | Wilmington, NC, USA | 408,978 | ||
| 29 | Jacksonville, FL, USA | 1,388,841 | 59 | Lirquen, Chile | 357,461 | * | |
| 30 | Veracruz, Mexico | 1,299,337 | 60 | Puerto Caldera, CR | 356,861 |
Source: author based on Kühne Professorial Chair in Logistics, Universidad de los Andes (Colombia), COCATRAM, ECLAC and UNCTAD. Notes: Figures in TEU. The ports of the USA and Canada are highlighted by light blue shading. * Provisional data.
The Top 60 table in 2025 concentrates 129.8 million TEUs, that is, 94.9% of the total continental sample. Reading the ranking suggests four observations. First, the top ten complexes account for 48.3% of the movement of the Top 60; the top five, 31.3%; the top twenty, 70.6%. It is, therefore, an industry highly concentrated in a relatively small group of nodes.
Second, the distribution by country reflects the dual architecture of the system. The USA and Canada have 19 ports and complexes in the Top 60, which account for approximately 49% of the movement in the table; Brazil contributes 10 units, Chile 6, Mexico 5 and Guatemala 3. Panama appears with only two complexes (Caribbean and Pacific) but both among the top ten positions, in line with their transshipment function.
Third, the top ten positions combine three well-identifiable functional types: gateways for large-scale domestic trade (Los Angeles, Long Beach, New York-New Jersey, Savannah, Houston), large Latin American export complexes (Santos, Cartagena, Manzanillo), and transshipment hubs of the interoceanic corridor (Panama Caribbean and Panama Pacific). This coexistence reflects the logic of modern containerisation, where the absolute ranking alone does not distinguish between origin or destination volumes and transshipment volumes (Notteboom et al., 2022).
Fourth, the middle and lower parts of the list (positions 30 to 60) bring together regional ports whose movement ranges between 350,000 and 1.3 million TEUs. This segment includes both ports with a multipurpose vocation and recently expanded dedicated terminals; its relative performance depends on the evolution of bilateral trade with Asia, Europe and the USA and the maritime connectivity offered by the main shipping lines.
Subregional ranking in 2025: main ports and port complexes
The subregional tables allow the conversation to be ordered by homogeneous geographical scales and complement the reading of the continental Top 60. The comparison between subregions shows the functional specialisation and the existing scale asymmetries.
| Insular Caribbean | North America | |||||||
| 1 | Kingston, Jamaica | 2,661,456 | 1 | Los Angeles, CA, USA | 10,200,000 | * | ||
| 2 | Caucedo, Dom. Rep. | 1,683,436 | 2 | Long Beach, CA, USA | 9,881,595 | |||
| 3 | San Juan, PR | 1,282,585 | * | 3 | New York-New Jersey, USA | 8,890,000 | * | |
| 4 | Freeport, Bahamas | 1,262,500 | * | 4 | Savannah, GA, USA | 5,703,287 | ||
| 5 | Rio Haina, Dom. Rep. | 528,019 | 5 | Houston, TX, USA | 4,303,345 | |||
| 6 | Port of Spain, T&T | 327,821 | * | 6 | Manzanillo, Mexico | 3,893,355 | ||
| 7 | Mariel & Havanna, Cuba | 265,000 | * | 7 | Vancouver, Canada | 3,778,996 | ||
| 8 | Point Lisas, T&T | 241,422 | * | 8 | Virginia, VA, USA | 3,611,600 | ||
| 9 | Jarry/Point a Pitre, Guadeloupe | 206,844 | 9 | Seattle+Tacoma (NWSA), USA | 3,074,530 | |||
| 10 | Fort de France, Martinique | 184,705 | 10 | Lazaro Cardenas, Mexico | 2,616,770 | |||
| 11 | Port au Prince, Haiti | 160,808 | * | 11 | Charleston, SC, USA | 2,600,000 | * | |
| 12 | Nassau, Bahamas | 140,400 | * | 12 | Oakland, CA, USA | 2,253,976 | ||
| 13 | Philipsburg, St. Martin | 134,684 | * | 13 | Montreal, Canada | 1,517,348 | ||
| 14 | Bridgetown, Barbados | 125,860 | 14 | Jacksonville, FL, USA | 1,388,841 | |||
| 15 | Willemstad, Curazao | 101,000 | 15 | Veracruz, Mexico | 1,299,337 | |||
Source: author based on Kühne Professorial Chair in Logistics, Universidad de los Andes (Colombia), COCATRAM, ECLAC and UNCTAD. Notes: Figures in TEU. * Provisional data.
In South America, the ranking is headed by the Santos complex, Brazil (5.80 million TEUs), followed by Cartagena, Colombia (4.14 million) and El Callao, Peru (3.32 million, excluding Chancay). The first fifteen ports total 32.2 million TEUs, reflecting the strong concentration in a few nodes linked to the main export corridors of the subcontinent.
In Central America, Panama leads the ranking on both fronts: the Caribbean complex (5.88 million TEUs) and the Pacific complex (4.03 million) alone explain the primacy of the isthmus as a transshipment platform. Limón-Moín, Costa Rica (1.39 million) constitutes the third node and operates as the main gateway for the country’s agricultural exports. The gap between Panamanian positions and the rest of the sub-ranking is consistent with the functional specialisation of the Panamanian market.
In the insular Caribbean, the leadership corresponds to Kingston, Jamaica (2.66 million TEUs) and Caucedo, Dominican Republic (1.68 million), two consolidated transshipment hubs. The scale of these two nodes contrasts with the rest of the island ports, whose movement is below 550,000 TEUs. San Juan (Puerto Rico) and Freeport (Bahamas) complete the upper segment with volumes between 1.26 and 1.28 million TEUs.
In North America, the West Coast of the United States dominates the ranking with Los Angeles (10.2 million TEUs) and Long Beach (9.88 million), followed by New York-New Jersey on the East Coast (8.89 million). Vancouver (Canada) and Manzanillo (Mexico) appear in the top ten of the sub-ranking. The coexistence of continental gates, Mexican export complexes and Canadian Pacific gateways reinforces the multipolar nature of the North American port system.
The relation between container port throughput and GDP
The literature uses different measures to describe the relationship between port activity, trade and GDP. One of them is the ratio between container movement and GDP growth rates for the same period, usually referred to as the TEU/GDP multiplier. Notteboom et al. (2022) place this relationship in the context of trade and containerisation developments. The online version of the graph “TEU to GDP multiplier, 1985-2024” distinguishes five phases: values of 2.0 to 2.5 before 1990, around 4.0 in the 1990s, around 3.0 in 2000-2008, approximately 2.8 in 2009-2014 and below 1.0 since 2015 (Port Economics, Management and Policy, 2022). The established periodisation corresponds to the growth indicator defined by that source, not the relative index used below.
Sanchez et al. (2016) document a consistent pattern and provide the region-specific estimate: the global multiplier fell from an average of 3.4 in the period 1990-1999 to 2.6 between 2000 and 2008, and to 1.5 since 2010, crossing the 1.0 threshold for the first time in 2015, when global container volume grew at less than half the rate of GDP expansion. For Latin America and the Caribbean, the decline is even more pronounced: from values around 5.0 during the 1990s, to 2.9 in the period 2004-2008, and to 1.45 between 2012 and 2014. The authors attribute the slowdown in container movement growth in the region to the combination of a drop in activity with lower regional GDP growth.
Constantinescu, Mattoo, and Ruta (2015), using an econometric model of world trade in goods and services, estimate a long-term income elasticity of 2.2 in 1986-2000 and 1.3 in 2001-2013. The European Central Bank (2014) obtains a ratio between average growth rates of imports and world GDP of 1.8 in 1981-2007 and 1.1 in 2011-2013, using GDP at purchasing power parity. Both results suggest a weakening of the relationship, but they are not methodologically equivalent estimates. Van Saase (2018) discusses factors associated with the decline in the TEU/GDP multiplier after 2012, including the lower expansion of emerging economies, productive relocation, the dematerialisation of demand, and geopolitical uncertainty. Effendhi (2017), citing the OECD (2014), shows a growth multiplier close to 3.0 for the ports of the Hamburg-Le Havre range in 1990-2010.
As an example of a measure of a different kind, Lee et al. (2025) estimate a logarithmic fixed-effect model for 83 countries in 2010-2022. The real GDP coefficient is 0.8508: a 1% increase in GDP is associated with an estimated 0.85% increase in port movement, conditioned by the variables in the model. It is an econometric elasticity, not the relative index defined in this study, and does not demonstrate causality on its own.
In short, the term “multiplier” does not necessarily designate a single formula: it may refer to quotients of annual rates, average or cumulative rates, to relationships between indices or, in less strict use, to estimated elasticities. Formulas, temporal aggregation and statistical conventions are not always made explicit in the same detail in the statements of results. Therefore, the coincidence of denomination is not sufficient to ensure numerical comparability.
For the mentioned reasons, and in order to avoid unnecessary ambiguities, this study makes the formula, its rationale and its interpretation explicit: the relative change in port movement per unit of real GDP is measured, not an elasticity or the quotient of its growth rates. The choice responds to this analytical question, not to the search for a predetermined range of results.
Th/GDP Multiplier – relative index of port movement/GDP
The indicator compares how much the port movement of containers changes in relation to real GDP over two years. It is calculated by dividing the growth factor of port movement by the GDP growth factor. Equivalently, it compares the port movement/GDP ratio of the final year with that of the initial year. This normalisation produces a dimensionless index, with a reference of equality in 1.
M(t, 0) = (Thₜ / Th₀) / (GDPₜ / GDP₀)
= (Thₜ / GDPₜ) / (Th₀ / GDP₀) = (1 + gTh) / (1 + gGDP)
Where Th₀ and Tht are the port movement of containers, measured in TEUs, in the beginning and final years; GDP₀ and GDPt are the real GDP levels of the same geographic unit, expressed in constant 2015 dollars. gTh = (Tht – Th₀) / Th₀ and gGDP = (GDPt – GDP₀) / GDP₀ are cumulative variations expressed in decimals. If percentages are used, they must be divided by 100 before adding them to 1. Positive levels and comparable geographic perimeters are required at both ends.
If M > 1, port movement per unit of real GDP increases; if M < 1, it decreases; if M = 1, it remains constant. Its percentage change is 100 × (M – 1). Thus, M = 1.20 means that the port movement/GDP ratio increased by 20%; it does not mean that the movement has grown 1.20% for every 1% of GDP growth. The index can exceed 1 with both economic expansion and contraction, depending on the relative evolution of both variables.
The basis of the indicator is to compare growth factors, and not to divide by a rate of change in GDP that may be very small, null or negative. Therefore, a GDP without growth does not make the index indefinite, as long as its level is positive. This property does not make the index an elasticity, a causal multiplier, a measure of productivity or an estimate of port value added.
Five windows are implemented: 2005/2000, 2010/2005, 2015/2010, 2019/2015 and 2025/2019, of 5, 5, 5, 4 and 6 years, respectively. Values are cumulative, not annualized: their magnitude between windows must be interpreted considering the varying duration. Latin America excludes the Caribbean, according to the filtering of the basis of the study. USA+Canada groups exclusively these two economies. These groupings should not be replaced by macroeconomic aggregates of different coverage.
As regards construction, the indicator remains positive. An indicator value equal to 1 indicates that port movement and GDP grew in the same proportion; a value greater than 1, that port movement grew above GDP; and a value below 1, which grew below, even when port movement contracted while GDP grew. This property distinguishes the indicator from the ratio of percentage changes, which can take on negative signs or extreme values when any of the series contracts or when the variation in GDP approaches zero, and is the reason why it is adopted as the reference indicator of the study.
| Th/GDP | 2005/2000 | 2010/2005 | 2015/2010 | 2019/2015 | 2025/2019 | |
| Jamaica | 1.99 | 1.16 | 0.85 | 0.90 | 1.55 | |
| Brazil | 1.92 | 0.96 | 1.19 | 1.27 | 1.32 | |
| Peru | 1.70 | 1.10 | 1.12 | 1.09 | 1.38 | |
| Mexico | 1.59 | 1.63 | 1.32 | 1.21 | 1.26 | |
| Uruguay | 1.57 | 1.11 | 1.02 | 0.88 | 1.06 | |
| Latin America | 1.55 | 1.29 | 1.14 | 1.13 | 1.24 | |
| Colombia | 1.48 | 1.63 | 1.22 | 1.16 | 1.15 | |
| World | 1.44 | 1.25 | 1.04 | 1.11 | 1.05 | |
| Chile | 1.39 | 1.26 | 1.04 | 1.06 | 1.06 | |
| USA+Canada | 1.30 | 1.02 | 1.10 | 1.07 | 0.94 | |
| Ecuador | 1.26 | 1.47 | 1.14 | 1.21 | 1.24 | |
| Caribbean | 1.10 | 1.10 | 0.83 | 0.99 | 1.06 | |
| Costa Rica | 1.10 | 1.07 | 1.08 | 1.00 | 0.91 | |
| Argentina | 1.07 | 1.08 | 0.80 | 1.16 | 1.03 | |
| Barbados | 1.07 | 1.21 | 1.19 | 1.11 | 1.14 | |
| St Lucia | 1.01 | 0.94 | 0.85 | 1.33 | 1.00 | |
| T&T | 0.91 | 1.02 | 0.79 | 1.12 | 1.18 | |
| Dominican Republic | 0.68 | 1.99 | 0.66 | 1.12 | 1.02 | |
Source: for real GDP is the indicator NY. GDP. MKTP. KD of the World Bank (accessed September 14, 2026), and for throughput the data analysed earlier in this same report are used.
The World index remains above 1 in all five windows, indicating cumulative increases in port movement per unit of real GDP. Its trajectory is not monotonous: it goes from 1.04 in 2015/2010 to 1.11 in 2019/2015 and to 1.05 in 2025/2019. Latin America registers 1.24 in the last window, while USA+Canada presents 0.94. These results describe relative changes, not elasticities; an index below 1 does not necessarily imply a drop in movement. The possible influence of maritime networks or transshipment requires additional information and is not inferred from the index alone.
In Latin America, the index remained above unity in the five windows, with higher values in the first two (1.55 in 2005/2000 and 1.29 in 2010/2005), consistent with the maturation of regional containerisation, and a recent recovery to 1.24 in 2025/2019. The Caribbean presents a more volatile behavior, always positive: 1.10 in 2005/2000 and 2010/2005, 0.83 in 2015/2010: the only period that registers lower than one, associated with the port contraction of the five-year period, 0.99 in 2019/2015 and 1.06 in 2025/2019. The United States and Canada show moderate values that converge towards 0.94 in 2025/2019, a sign that in the most recent window port activity grew below output.
At the country level, the highest values correspond to economies in which port expansion in the period was much higher than that of GDP. Colombia maintains indices above unity in all five windows, with a maximum of 1.63 in 2010/2005. Ecuador registers 1.26 in 2005/2000, 1.47 in 2010/2005 and 1.21 in 2019/2015. Peru reaches 1.70 in 2005/2000 and remains above one in all subperiods. Brazil combines a high value in 2005/2000 (1.92) with a subsequent trajectory that oscillates close to unity and returns to 1.32 in 2025/2019. Mexico has 1.59 in 2005/2000 and 1.63 in 2010/2005 and then approaches intermediate values.
Cases with values below unity, always positive, correspond to periods in which port movement grew less than GDP or contracted. Argentina 2015/2010 (0.80), Dominican Republic 2005/2000 (0.68) and 2015/2010 (0.66), Jamaica 2015/2010 (0.85) and 2019/2015 (0.90), Saint Lucia 2010/2005 (0.94) and 2015/2010 (0.85), Trinidad and Tobago 2005/2000 (0.91) and 2015/2010 (0.79) and Uruguay 2019/2015 (0.88) make up this set. In all cases, the interpretation is direct: port movement lost relative share of output, without the indicator changing sign.
In summary, three complementary readings emerge from the table. First, the slowdown in the coupling between port movement and GDP is consistent and is reproduced in the main aggregates. Second, Latin America and the Caribbean maintain indices above one in most windows, with heterogeneity country by country. Third, values below one are implicitly informational, without the need to resort to negative signs or extreme magnitudes and should be read as a relative loss of port intensity and not as a negative elasticity.
Some conclusions on the trajectory of container port activity between 2000 and 2025
The port movement of containers in the Americas went from 40.8 million TEUs in 2000 to 136.8 million in 2025, with an average expansion rate of 4.86% per year. This rate, lower than the global rate (6.18%), explains the sustained decline in the relative share of the continental as a whole, with a decline from 18% to 13.5% of the world total. Latin America and the Caribbean maintains its share at around 6.9% over the entire horizon. The trajectory is divided into two tranches: 5.89% per year between 2000 and 2015, and 3.32% between 2015 and 2025, consistent with the maturation of global containerisation.
The 2025 ranking confirms three structural features of the system. First, it is a concentrated industry: the top ten complexes account for 48.3% of the Top 60 movement. Second, the architecture is dual, with large-scale continental gateways (Los Angeles, Long Beach, New York-New Jersey, Savannah, Santos, Cartagena, Manzanillo) and specialised transshipment hubs (Panama Caribbean and Pacific, Kingston, Caucedo). Third, the subregional map distinguishes a diversified South America, a Central America polarised by Panama, an insular Caribbean supported by two consolidated hubs, and a multipolar North America. The impact of the pandemic in 2020 was less on port movement than on GDP, and the 2023 correction particularly affected the USA and Canada.
The relative Th/GDP index, defined as (Tht/Th₀)/(GDPt/GDP₀), allows us to discuss the relationship between port movement and economic activity without resorting to the growth rate quotient. The world index remains above unity in the five five-year windows, with a downward trajectory. Latin America falls from 1.55 in 2005/2000 to 1.24 in 2025/2019, still above unity. USA+Canada stands at 0.94 in the last window. For this indicator, three differentiated patterns have been identified in the trajectory of the five analysed time windows:
- A first group describes a U: it starts at high values, reduces in the intermediate windows to a minimum and rebounds towards the final window. This group is made up of Jamaica, Brazil, Peru and, with a more pronounced decline in the middle part, the Dominican Republic; Caribbean, Argentina and Trinidad & Tobago present the same shape with lower general levels, although the final rebound is equally clear.
- A second group maintains a downward trend throughout the period, with minor oscillations and no final recovery: Latin America, Colombia, World, Chile, USA and Canada and Costa Rica; in all these cases the most recent window is below the initial one.
- A third group shows a frankly growing or sustained expansive trajectory, with values that remain above unity in most windows and a final phase that equals or exceeds the records of the beginning: Mexico, Ecuador and Barbados.
Overall, the container port system of the Americas continues to integrate with the dynamics of world trade, although with less relative weight, and the relative indicators complement the reading of the absolute rankings without replacing them.
References
Braig, M. & Baur, C. U. (2005). Western Hemisphere Divided? Or: How far does Mexico go? Ibero-American. Latin America, Spain, Portugal, 5(20), 109-125.
CARICOM (2003, July 2). Agreement between the Caribbean Community and the Government of Bermuda. http://www.commonlii.org/caribbean/other/treaties/CaricomTSer/2003/2.pdf
Chang, Y.-T., Shin, S.-H., & Lee, P. T.-W. (2014). Economic impact of port sectors on South African economy: An input-output analysis. Transport Policy, 35, 333-340. https://doi.org/10.1016/j.tranpol.2014.04.006
Clarksons Research (2003). Container Intelligence Monthly, 5(11). Clarkson Research Studies.
Constantinescu, C., Mattoo, A., & Ruta, M. (2015). The global trade slowdown: Cyclical or structural? (IMF Working Paper 15/6). Fondo Monetario Internacional. https://www.imf.org/-/media/websites/imf/imported-full-text-pdf/external/pubs/ft/wp/2015/_wp1506.pdf
DynaLiners (2026). Millionaires 2026. Dynamar BV.
Economic Commission for Latin America and the Caribbean. (1992). Latin American and Caribbean relations (LC/CAR/G.379). United Nations, Subregional Headquarters for the Caribbean, Caribbean Development and Cooperation Committee.
Effendhi, A. (2017). An empirical study of container growth by delinking it with GDP [Tesis de maestría, Erasmus University Rotterdam]. https://thesis.eur.nl/pub/40483/Thesis-Arief-Effendhi.pdf
European Central Bank (2014). Understanding global trade elasticities: What has changed? Monthly Bulletin, July 11-13. https://www.ecb.europa.eu/pub/pdf/other/mb201407_focus01.en.pdf
Hoffmann, B. (2025). More than adding a “C” to the acronym: Where is the Caribbean in Latin American studies? European Review of Latin American and Caribbean Studies, (120), 27-33. https://doi.org/10.32992/erlacs.11445
Lee, J., Ryu, W., Kim, Y.-S., & Lee, C.-H. (2025). Analysing the impact of climate resilience on container terminal throughput: A continent-wide comparative study. Journal of Marine Science and Engineering, 13, 2225. https://doi.org/10.3390/jmse13122225
Notteboom, T., Pallis, A. & Rodrigue, J. P. (2022). Port economics, management and policy. Routledge. https://doi.org/10.4324/9780429318184
Pantojas García, E. (2011). Nation, region and fragmentation in the contemporary Caribbean. Memoirs: Digital Journal of History and Archaeology from the Caribbean, (15). http://www.scielo.org.co/scielo.php?script=sci_arttext&pid=S1794-88862011000200002
Port Economics, Management and Policy (2022). TEU to GDP multiplier, 1985-2024. Retrieved September 17, 2026. https://porteconomicsmanagement.org/pemp/contents/ part1/maritime-shipping-and-international-trade/teu-to-gdp-multiplier/
Sánchez, R. J., Doerr, O., & Nunes, S. (2016). A slowdown in performance of container trade and port activity in Latin America, the Caribbean and the world, 2014-2015. Maritime & Logistics Bulletin, (61), 1-6. CEPAL. https://www.cepal.org/sites/default/files/news/files/mb61_march.pdf
Schoultz, L. (1998). Beneath the United States: A history of U.S. policy toward Latin America. Harvard University Press.
Spalding, M. D. (2004). A guide to the coral reefs of the Caribbean. University of California Press.
United Nations (2026). Standard country or area codes for statistical use (M49). Statistics Division. Retrieved September 17, 2026. https://unstats.un.org/unsd/methodology/m49/
van Saase, N. (2018). The impact of 50,000 TEU vessels on the container supply chain [Master’s thesis, Erasmus University Rotterdam]. https://thesis.eur.nl/pub/44340/Saase-N-van-484018-MA-thesis.pdf
Whitaker, A. P. (1954). The Western Hemisphere idea: Its rise and decline. Cornell University Press.
Williams, E. H., Jr., & Bunkley-Williams, L. (2021). What and where is the Caribbean? A modern definition. The Florida Geographer, 52, 3-28. https://journals.flvc.org/flgeog/article/download/128940/130227/218865
World Bank (2026). GDP (constant 2015 US$). World Development Indicators. Retrieved September 14, 2026. https://data.worldbank.org/indicator/NY.GDP.MKTP.KD