
By [1] Ricardo J Sanchez [2] Eliana P. Barleta
[1] Co-chair, Kühne Professorial Chair in Logistics, School of Management, Universidad de los Andes, Colombia and Head, Caribbean Research Institute. [email protected]
[2] Ph.D. Student in Maritime Studies, University of Piraeus [email protected]
***
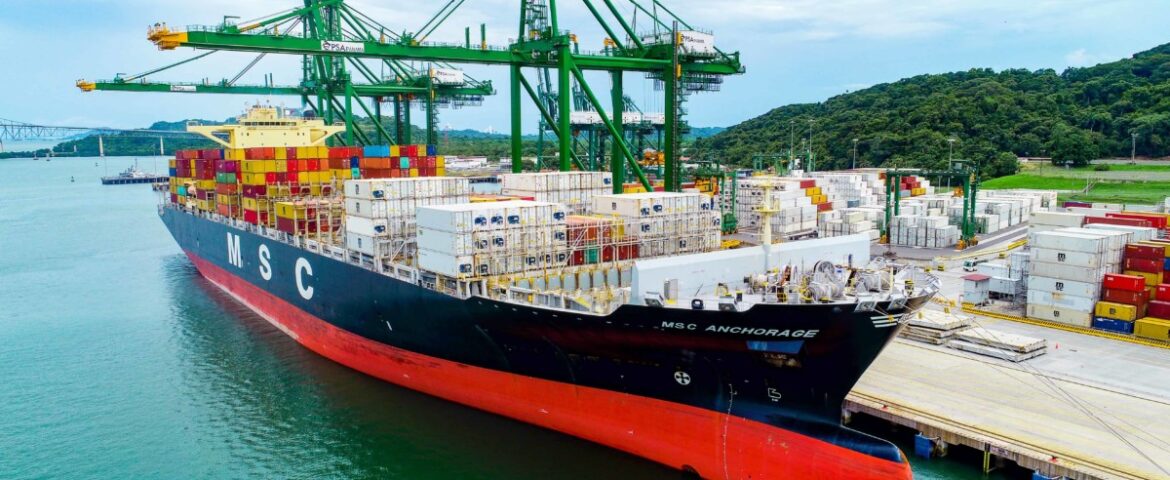
The ports of the Caribbean, framed by the natural beauty of the region, have the dual characteristic of being vital to regional trade, but also function as strategic transhipment nodes on international trade routes connecting Europe, North America and Asia.
It should be noted that ports on smaller islands, beyond their natural beauty, tend to have significant infrastructure deficits, obsolescence in several cases, and limited land availability to serve multiple functions such as general cargo, cruise ships, liquid and dry bulk, and containers. This makes them highly significant in terms of the challenges they face in the future. Table 1 shows that among the 25 largest ports, there is a mix of ports handling less than 100,000 TEU per year, with several handling over 1 million TEU, and up to 5 million TEU in a year.
This brief note presents an analysis of the 25 largest container ports and terminals in the Caribbean, highlighting their throughput, changes in activity over the (selected) years and their role in transhipment.
Table 1 shows the throughput in thousands of TEUs of the main Caribbean ports and container terminals from 2010 to 2023. The data shows that Panama’s Caribbean coast has consistently ranked first in terms of volumes operated, peaking (to date) in 2022 at just over 5.1 million TEUs, despite a slight decline in 2023 to 4.9 million TEUs. Panama’s Pacific coast ranks second in 2023, with remarkable growth since 2010, while Colombia’s Cartagena Bay has risen to third place in 2023, demonstrating steady growth over the years. Kingston in Jamaica has been among the top-5 in the region since 2010.
Table 1. Port throughput, 2010-2023, in TEU
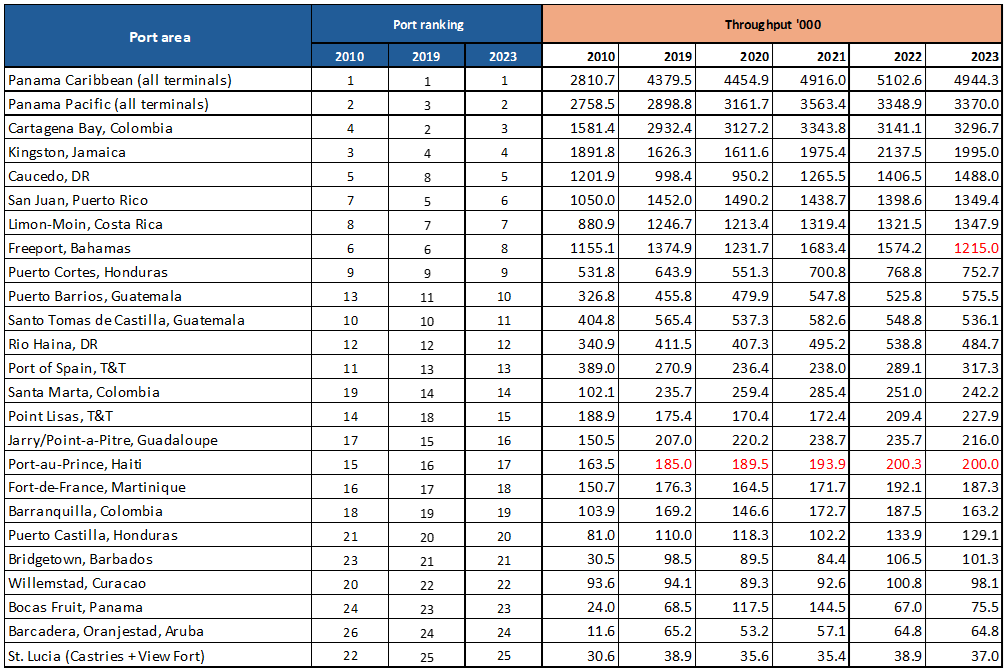
Source: authors, based on data obtained from port authorities and operators. Note: the table is based on available data to date, so there may be some omissions. Estimated or provisional figures in red.
Table 2 highlights the percentage changes in throughput in 2023 compared to previous years, providing insight into the growth and fluctuation of port activity. In the long term, since 2010, Cartagena has experienced a remarkable increase of 108.5%, underlining its expansion, within the millionaires group. Panama’s Caribbean coast also shows a significant growth of 75.9%, consolidating its crucial role as a maritime hub. Within the smaller volume ports, several ports show a 3-digit percentage change in the long term, such as Barcadera, Bridgetown, Bocas Fruit and Santa Marta.
In the medium term, i.e. variations with respect to the pre-pandemic, Caucedo, Point Lisas, Puerto Barrios and Kingston stand out. In the short term, over the previous year, the cases of Bocas, the ports of Trinidad and Tobago, Puerto Barrios, Caucedo and Cartagena stand out. However, not all ports have shown recent growth. Freeport in the Bahamas has seen a 22.8% decrease compared to 2022, as well as Barranquilla and Rio Haina.
Table 2. Port throughput, 2010-2023, variation in %.
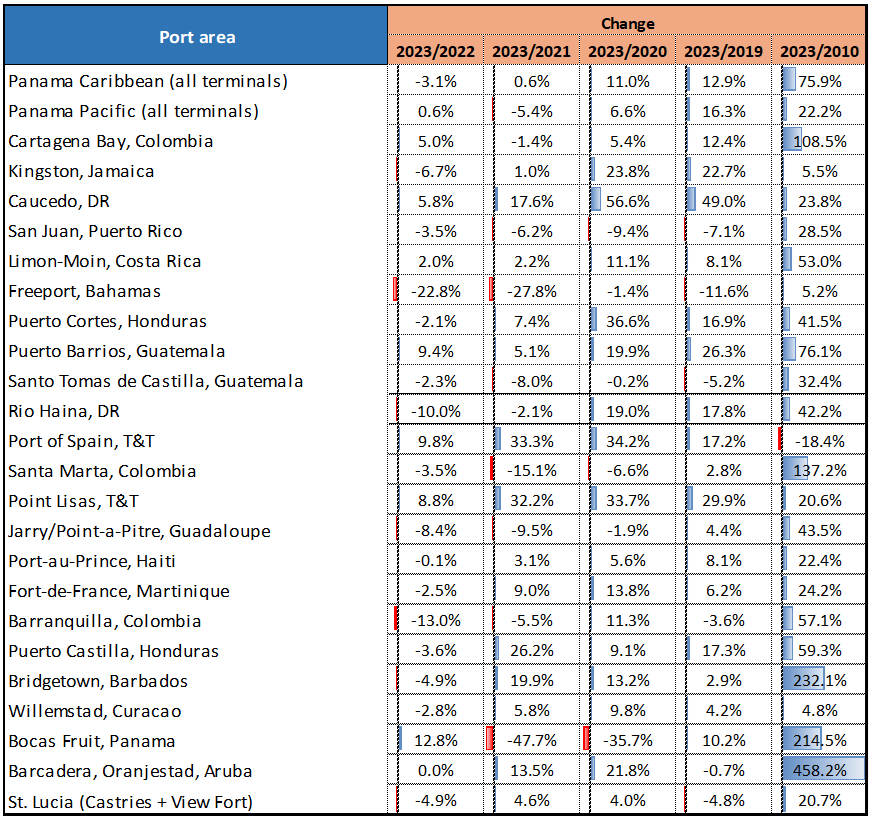
Source: authors, based on data obtained from port authorities and operators.
Table 3 shows the share of transhipment with respect to port throughput. Both coasts in Panama are leaders in transhipment, maintaining percentages close to 90%, which underlines their key role in the region, as well as Freeport and Kingston (all above 84% average in the last 5 years). The ports of Cartagena and Caucedo show a strong trend for transhipment, although they also exhibit their relevance as gateways. Something similar occurs with Port of Spain, although in a smaller proportion (33% of the total).
Table 3. Transshipment/throughput 2010-2023, in %
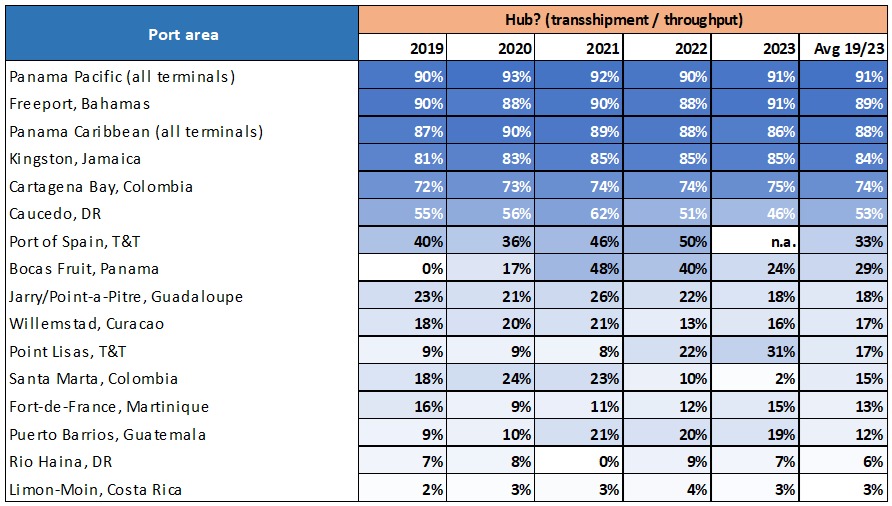
Source: authors, based on data obtained from port authorities and operators. Note: n.a. not available.