Viewpoints

April 11th, 2016
Viewpoints

 COMMENT: A quick way to get an understanding of the development potential of the ports industry in a country is to look at the throughput per capita, writes Peter de Langen. Eurostat publishes such data and the ‘usual suspects’ score highly. The Netherlands handles about 33 tons per year per capita and Belgium about 20, compared with the EU average of 7.3. However, Norway has the highest ratio - over 40 ton per capita - due to substantial import and export flows of liquid and dry bulk. Naturally, some countries have volume/capita...
April 4th, 2016
Viewpoints

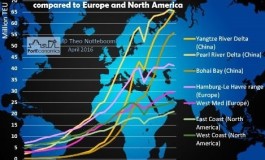
By Theo Notteboom The figure shows the evolution of container throughput in the three main container port regions in China (i.e. Yangtze River Delta, Pearly River Delta and the Bohai Rim). We compare these volume dynamics with some key port systems in North America and Europe: the port system along the North American West Coast including ports such as Seattle/Tacoma, Vancouver, LA, Long Beach and Oakland; East coast ports such as Norfolk, Charleston, New York/New Jersey, Baltimore, Savannah and Halifax; the Hamburg-Le Havre port range...
March 30th, 2016
Viewpoints

A 5,62% increase of passenger movements comparing to 2014 was registered in Mediterranean cruise ports in 2015. The variation of cruise passenger movements in the second biggest cruise region of the world is positive when one relates the numbers with the one that had taken place at the beginning of the decade. In 2015 cruise ports in the Med and its adjoining seas hosted 10,7% more passenger movements than in 2010. MedCruise the association cruise ports in the Med and its adjoining seas revealed that a total of 27.206.023 cruise...
March 23rd, 2016
Viewpoints

COMMENT: Last year was a year of differing fortunes for Belgium seaports, writes Peter de Langen. Volumes in Zeebrugge dropped by over 20%, from more than 2m teu to slightly over 1.5m teu, and PSA decided to close down its container terminal in the port. Meanwhile, volumes in Antwerp grew. Antwerp grew with roughly the amount of volumes that was lost in Zeebrugge, and here MSC and PSA are expanding and relocating their jointly operated terminal. Antwerp Port Authority is also pushing ahead with the development of a new dock, the so...
February 29th, 2016
Viewpoints

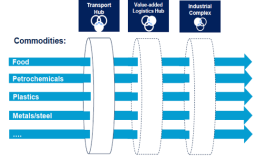
The combination the three port products- 1. Transport hub, 2. Value-added logistics hub and 3. Industry, the strengthens of the overall port complex and the market segments for these three products were at the centre of PortEconomics co-director Peter de Langen presentation during the two-days workshop organised by the Arab Academy for Science, Technology and Maritime Transport, on 21-22 February in Jeddah, Saudi Arabia. Peter focused on the Golf Cooperation Countries  (GCC) transition challenges and analysed the quality for container...
February 24th, 2016
Viewpoints

By Peter de Langen COMMENT: In many countries, port development and the development of, often adjacent, sites for industrial activities is traditionally done by different, state-owned entities, writes Peter de Langen. This is the case in South Africa, where one organisation is responsible for Coega port and another is responsible for the adjacent industrial zone. Similar examples can be seen in Brazil and Indonesia. There are ongoing discussions about the benefits of an integrated model. I would argue that such an integrated...
February 23rd, 2016
Viewpoints

By Theo Notteboom The portgraphic shows the top 15 container ports in the European Union in 2015 based on container throughput expressed in TEU. It also includes container growth figures compared to 2014 and pre-crisis year 2007. What can we observe? 1. The total volume of the top 15 ports saw a small traffic decline of 1.6% compared to 2014, or one of the worst y-o-y growth figures in Europe's container history. Only the dramatic year 2009 brought a larger drop in container throughput handled by the top 15 ports (i.e....
February 18th, 2016
Viewpoints

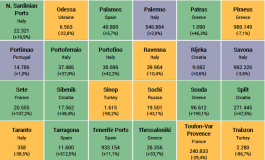
By George Vaggelas The Greek economy is going through the eighth year of economic recession as the economic crisis in Greece started at the end of 2008 and continues today. In this environment, Greek ports tried to respond to a series of challenges such as the reduction in consumption in the internal market, the reduction in the competitiveness of the Greek economy as well as some inherent challenges such as the resuction of ports personnel. The PortGraphic outlines how Greek ports (and more specifically the 12 ports operating as Societe...
February 17th, 2016
Viewpoints

By Jonas Constante According to a recent report by the consulting firm Mckinsey & Co, across Europe as a whole, infrastructure congestion costs 1% of GDP. In 2013, globally, $400 billion a year could be saved by making more of existing infrastructure through improved demand management and maintenance. The digitalization can create value for private and public stakeholders involved in the logistic port sector through various initiatives, among which we highlight: i) eGovernment and the creation of administrative single...
February 7th, 2016
Viewpoints

How to measure port performance? Logistics performance is a strong determinant of national economic competitiveness. Understanding and decomposing the components of logistics performance can help countries to improve efficiency of logistics systems as well as the functioning of related infrastructures, services, procedures and regulations. A sound and comprehensive set of national-level performance indicators is critical for high-level policy dialogue, preparation and implementation. Invited to participate in the Roundtable on Logistics...
Page 18 of 29...1617181920...