


By Theo Notteboom
Total container throughput in the EU increased by 13.9% between pre-crisis year 2007 and 2016. Rotterdam is the largest container port in Europe (12.38 million TEU in 2016) followed by Antwerp (10.04 million TEU) and Hamburg (8.91 million TEU). When grouping seaports together in multiple-port regions we get a better picture of the container port handling hotspots in Europe.
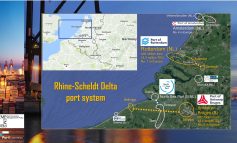
Observation 1 – The Rhine-Scheldt Delta is, more than ever, the stronghold of the Hamburg-Le Havre range
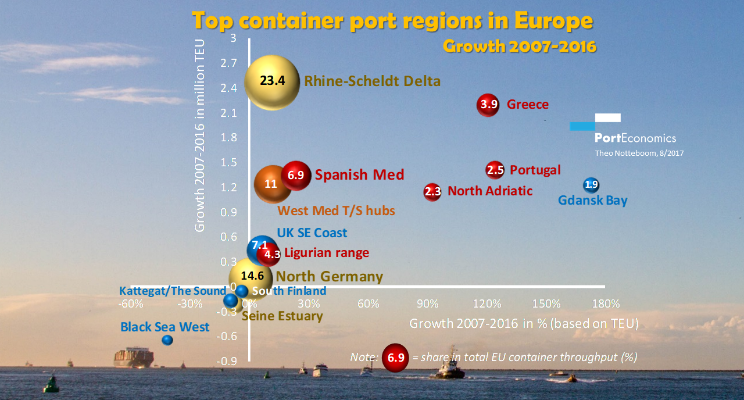
With 24 million TEU handled in 2016, the Rhine-Scheldt Delta remains the most important container port region in Europe in volume terms. Compared to 2007, the Delta’s container throughput increased by 2.47 million TEU or 11.5%. The share of the Rhine-Scheldt Delta in total EU container throughput shows moderate fluctuations in the 23-25% range since 2007. In 2016, its share reached 23.4% compared to 23.9% in 2007. Rotterdam and Antwerp, the largest container ports in the region and Europe, have seen healthy growth figures in the period 2007-2016 (i.e. 14.8% and 22.8% respectively). Belgian coastal port Zeebrugge witnessed a decrease of 31% in the same period, mainly caused by a weakening position in the calling patterns of alliances/carriers on the Europe-Far East trade.
Observation 2 – North-German port system back at pre-crisis volumes, but not more than that
The North-German container ports (initially only Hamburg and Bremerhaven, but since 2012 also Wilhelmshaven) managed to increase the joint traffic share in Europe from 13% in the late 1990s to 16.5% in 2007. Bremerhaven’s volume surge and Hamburg’s pivotal role in feeder flows to the Baltic and rail-based flows to the developing economies in East and Central Europe were the main causes. However, sharp volume drops in 2009, i.e. minus 28% in Hamburg mainly due to a loss of transhipment flows to Rotterdam and minus 16% in Bremerhaven, brought the traffic share below 15%. By 2012 the region’s position recovered to 15.8%, but then gradually slipped to 14.6% in 2016. The North German port system recorded a minuscule growth of 0.6% between 2007 and 2016 to reach 14.94 million TEU in 2016. The region welcomed newcomer Wilhelmshaven in 2012 when the JadeWeserPort was opened for business. With a volume of 481,720 TEU in 2016, volume growth at the new large scale terminal facility is picking up although the overall volume remains far below the terminal’s capacity. Hamburg’s container volume in 2016 was 10% below its record year 2007. The deepening of the Elbe river is high on the agenda in Hamburg as the port is currently facing some restrictions to accommodate the largest container vessels.
Observation 3 – Seine Estuary below 2007 volume, but stable volume share in past few years
The Seine Estuary, the third region in the Le Havre-Hamburg range, suffered from a gradual decline in its share from 5.5% in 1989 to 3.0% in 2007. The ‘Port 2000’ terminals in Le Havre, a new hinterland strategy, the completed port reform process and the HAROPA initiative aimed at closer cooperation between Le Havre, Rouen and the inland port of Paris are aimed at a ‘renaissance’ of Le Havre. While the Seine Estuary’s TEU throughput is about 8% below the 2007 volume, the region’s share in European container traffic remained rather stable at 2.5% in the past few years.
Observation 4 – Southern European ports are on the rise
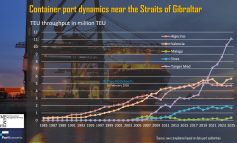
The graph clearly shows that port regions in south Europe (all indicated in red) are the major winners in volume terms in the period 2007-2016. Piraeus is responsible for the steep growth of the Greek container port system. The port’s container volume increased from 1.37 million TEU in 2007 to 3.67 million TEU in 2016. Despite traffic losses in Thessaloniki during the same period, Greece now ranks as the seventh largest container port region in Europe with a share of 3.9% of total EU container throughput (up from 2% in 2007). The region recorded the second highest TEU growth in Europe in the period 2007-2016 (only preceded by the Rhine-Scheldt Delta) and the third largest growth in percentage terms (after Gdansk Bay and the Portuguese port system).
Portuguese ports are trying very hard to expand business by developing a transhipment role as well as tapping into the Spanish market through rail corridor formation and dry port development. After a long period of declining market shares, the Portuguese port system succeeded to lift its European share to 2.5% in 2016 (up from 1.3% in 2007). The port of Sines recorded the strongest traffic growth mainly due to increasing volume commitments of MSC and a further extension of the PSA/MSC operated terminal facility. Sines reached 1.51 million TEU in 2016, 10 times more than in 2007. The volume of Leixoes increased by 50% in the same period, while Lisbon handled 30% fewer containers in 2016 compared to 2007.
For a long time, the North-Adriatic ports had been facing lower than average growth rates. However, since the crisis year 2009 the tide seems to have turned. In 2016, this port region already represented 2.3% of the total European container volume. In the 2007-2016 period, the North Adriatic added 1.15 million TEU to its container throughput or a high growth of 92%. The cooperation agreement NAPA (North Adriatic Ports Association) underlines the ambition of the region to develop a gateway function to Eastern and Central Europe and the Alpine region. The port region is also very active in tapping into the One Belt One Road (OBOR) initiative.
Before the crisis, the Spanish Med port region recorded a growth of its European share from 4% in 1993 to 6.3% in 2007. By 2016, its share increased further to 6.9% representing a growth of 1.34 million TEU or 23.6% compared to 2007. However, the growth path of the individual ports is quite different. Barcelona was hit hard by the crisis with a volume drop from 2.57 million TEU in 2008 to 1.8 million TEU in 2009. Container activities started to recover only in the past few years to reach 2.24 million TEU in 2016. At the other extreme, Valencia recorded a spectacular and consistent growth (also during 2009) from 3.6 million TEU in 2008 to 4.47 million TEU in 2012. MSC’s choice to use the port as a hub for the region boosted transshipment volumes. After a short period of stagnation, growth resumed in the past few years to reach 4.72 million TEU. Malaga and Tarragona are among the smaller container ports in this port region.
Ligurian ports in Italy represent some 4.3% of the total European port volume in the past few years, a decline compared to 6-7% throughout the 1980s and 1990s. The port system saw a modest growth of 9.8% in the 2007-2016 period. It is the only south European port region showing a figure below the 13.9% growth of the entire EU port system. Genoa, the largest port in the region with 2.3 million TEU in 2016, is the strongest grower in the 2007-2016 timeframe (+24%). Ligurian ports rely heavily on the cargo rich economic centres in northern Italy.
Observation 5 – Strong growth differences between Europe’s ‘pure’ transhipment hubs in the West Med
The ‘pure’ transhipment hubs in the West Med emerged in the mid 1990s mainly to serve the growing number of Asia-Med services. Combined, these hubs saw a growth of 12% and 1.2 million TEU in the 2007-2016 timeframe. Algeciras at the southern tip of the Iberian Peninsula was the first to reap the benefits of its geographical location, but is now facing strong competition from newer kids on the transhipment business block such as Tanger Med (Morocco) and Sines (Atlantic side). Still, Algeciras managed to realize a growth of 39% between 2007 and 2016 to reach a record throughput of 4.76 million TEU last year. The Italian transhipment hubs showed mixed results. Gioia Tauro passed the 3 million TEU marker back in 2003, but has been facing some up and downs since then. The port recorded a traffic loss of 17% between 2007 and 2016. Taranto reached nearly 0.9 million TEU in 2006, but at present does no longer play a role in the transhipment market. Cagliari’s container traffic has been fluctuating around 600,000 TEU since 2005.
Observation 6 – Revival of the UK Southeast coast?
In the 2007-2016 period, the UK SE Coast port region added 0.44 million TEU to its container throughput. This represents a modest growth of 6.4% or less than half the growth of the total EU container port system in the same period. This port region witnessed a rather significant decrease in its EU container share till the early 2010s. With new capacity in place, the UK ports have been able to attract more direct calls and to increase their joint share from 6.4% in 2012 to 7.1% in 2016. Felixstowe and Southampton remain the main gateways in the UK container port system, while Thamesport gradually lost its role as port of call on the major east-west trade routes. The relatively new London Gateway is starting to have an impact on competitive dynamics as well.
Observation 7 – Gdansk bay as star region in the Baltic/Scandinavia
In the last couple of years, the ports in the Bay of Gdansk are witnessing a healthy growth and an increasing traffic share in Europe (now 1.9% compared to 0.8% in 2007 and 0.5% in 2004). In the 2007-2016 period, the Gdansk bay port region added 1.23 million TEU to its container throughput or a high growth of 173%. For a long time, the Polish load centres were bound by their feeder port status, competing with main port Hamburg for the Polish hinterland. However, the Polish port reform process gave impetus to the development of new container handling facilities. While Gdynia gained only 4.5% more container volume in the period 2007-2016, Gdansk saw a steep growth from 97,000 TEU in 2007 to 1.3 million TEU in 2016. The DCT facility in Gdansk serves as a port of call on some of the main Europe-Far East services. The port is determined to become a hub for Central and Eastern Europe and Russia.
The success of the Gdansk bay port region is in contrast to the modest traffic losses in the port system at the entrance of the Baltic (Kattegat/the Sound) and South Finland. While both port regions are losing ground in traffic terms, Scandinavian ports remain highly dynamic players in the market and are European pioneers in far-reaching port cooperation schemes and sustainable port development. For example, the port of Gothenburg in Sweden serves as a good practice in intermodal network development: half of the port’s container volume is transported inland via an extensive domestic rail network of container shuttles.
Observation 8 – No revival (yet) of the EU Black Sea ports
The Black Sea ports, Constantza in particular, were on the rise in the early 2000s from virtually no traffic to a European share of 1.7% in 2008. Constantza attracted terminal investments given its potential to serve as a gateway to eastern Europe and a transshipment hub for the Black Sea area. The crisis abruptly ended this unfolding success story: Constantza’s container throughput fell sharply from 1.38 million TEU in 2008 to 594,299 TEU in 2009. In the following years, the port could only present a modest growth to reach 711,339 TEU in 2016. The Bulgarian ports of Varna and Burgas remain small players in the container market. Overall, the western part of the Black Sea port region recorded a decline of some 640,000 TEU in the 2007-2016 period which represents a traffic loss of some 42%. The traffic decline in Black sea ports is in sharp contrast to strong growth witnessed at Piraeus and Turkish deepsea ports near the Sea of Marmara. This development demonstrates shipping lines for the time being prefer a hub-feeder model in the Med to service the Black Sea area instead of direct deepsea calls in the Black Sea.