• Home
  • About
    • Members
    • Associate Members
    • Former members
  • Thematic Areas
    • Containers
    • Cruise
    • European Port Policy
    • Ports & COVID-19
  • PortStudies
  • Presentations
  • Noticeboard
  • Viewpoints
  • PortLibrary
  • PortReport
PortEconomics
  • October 18th, 2025
PortEconomics
  • Home
  • About
    • Members
    • Associate Members
    • Former members
  • Thematic Areas
    • Containers
    • Cruise
    • European Port Policy
    • Ports & COVID-19
  • PortStudies
    Geopolitical risks and port-related carbon emissions: evidence and policy implications

    Geopolitical risks and port-related carbon emissions: evidence and policy implications

    Investments and financing challenges of the EU’s port managing bodies; findings from a comprehensive survey

    Investments and financing challenges of the EU’s port managing bodies; findings from a comprehensive survey

    Evaluating customer satisfaction with clearing and forwarding agents:  Kuwait Shuwaikh Port

    Evaluating customer satisfaction with clearing and forwarding agents: Kuwait Shuwaikh Port

    Digital technologies for efficient and resilient sea-land logistics

    Digital technologies for efficient and resilient sea-land logistics

    Stakeholders’ attitudes toward container terminal automation

    Stakeholders’ attitudes toward container terminal automation

  • Presentations
    Port reform: World Bank publishes the third edition of its port reform toolkit

    Port reform: World Bank publishes the third edition of its port reform toolkit

    When will we admit that maritime transport will not be decarbonised by 2050?

    When will we admit that maritime transport will not be decarbonised by 2050?

    Digital technologies for efficient and resilient sea-land logistics

    Digital technologies for efficient and resilient sea-land logistics

    The World Ports Tracker in TOC Europe

    The World Ports Tracker in TOC Europe

    Newly-upgraded IAPH World Ports Tracker identifies major sustainability and market trends

    Newly-upgraded IAPH World Ports Tracker identifies major sustainability and market trends

  • Noticeboard
    Portgraphic: Top-15 EU container ports in H1 2025

    Portgraphic: Top-15 EU container ports in H1 2025

    PhD posts in the area of ports and energy transition

    PhD posts in the area of ports and energy transition

    PortEconomics members among best-performing scholars globally

    PortEconomics members among best-performing scholars globally

    Accessibility or connectivity: why is it correct to say that in the Caribbean the main logistics problem is connectivity?

    Accessibility or connectivity: why is it correct to say that in the Caribbean the main logistics problem is connectivity?

    Cruise Port-City Compass

    Cruise Port-City Compass

  • Viewpoints
    Portgraphic: Top-15 EU container ports in H1 2025

    Portgraphic: Top-15 EU container ports in H1 2025

    Portgraphic: fleet capacity (owned/chartered) of container shipping lines

    Portgraphic: fleet capacity (owned/chartered) of container shipping lines

    In a tight spot: American ports in global supply chains

    In a tight spot: American ports in global supply chains

    Cruise industry in 2025 at a glance

    Cruise industry in 2025 at a glance

    The box that makes the world go around: container terminals and global trade

    The box that makes the world go around: container terminals and global trade

  • PortLibrary
  • PortReport
PortGraphic: Top10 container ports in mainland China in 2018Containers

PortGraphic: Top10 container ports in mainland China in 2018

February 26th, 2019 Containers, Featured

READ ALSO

Portgraphic: Top-15 EU container ports in H1 2025
Portgraphic: fleet capacity (owned/chartered) of container shipping lines
Evaluating customer satisfaction with clearing and forwarding agents:  Kuwait Shuwaikh Port
Evaluating customer satisfaction with clearing and forwarding agents: Kuwait Shuwaikh Port
Geopolitical risks and port-related carbon emissions: evidence and policy implications

By Theo Notteboom

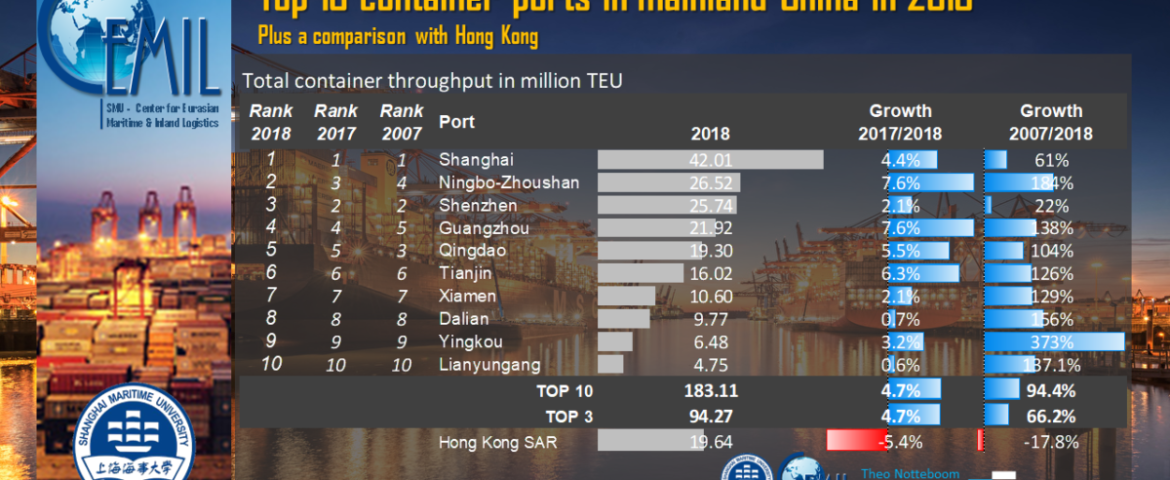
The table provides an overview of the total TEU throughput in 2018 of the top 10 container ports in mainland China (plus Hong Kong) and also shows the growth figures 2017/2018 and 2007/2018. The figures lead to the following conclusions.

Shanghai remains the no. 1 container port in mainland China and the world

The top 10 ports in China handled 183 million TEU in 2018 or +4.7% compared to 2017. Shanghai in the Yangtze River Delta remains the undisputed no. 1 container port in mainland China and the world with over 42 million TEU in 2018 (+4.4%). The Chinese government developed a strong focus on Shanghai in the mid-1990s. As a result the Yangtze River Delta emerged as the most prominent container growth region in China reaching an elevated average annual growth of 30% in container throughput between 1995 and 2005. Last year, Shanghai’s neighbour, the port Ningbo-Zhoushan in Zhejiang province, climbed to second place at the expense of Shenzhen, the leading port in the Pearl River Delta. Another Pearl River Delta port, Guangzhou, kept its fourth position. Both Shenzhen and Guangzhou now handle more containers than the third largest hub in the Pearl River Delta, i.e. Hong Kong. Qingdao in Shandong province is the highest ranked port of northeastern China in the list. Ningbo-Zhoushan and Guangzhou recorded the strongest growth in 2018 among the top ten ports, but did not reach double digit growth figures which were characteristic for the Chinese container port system throughout the 1990s and 2000s. In fact, the 4.7% growth of the top 10 ports is similar to the 4.8% growth of the top 15 ports in Europe in 2018.

Top 10: A traffic growth of 94% in the period 2007-2018

All top 10 ports now handle more containers than in pre-crisis year 2007, with Yingkou (Liaoning province) and Ningbo-Zhoushan showing the strongest growth. Shenzhen and Shanghai are the only mainland Chinese ports with ‘only’ a double digit and not a triple digit growth rate in the period 2007-2018.

The results for Hong Kong are in sharp contrast to the situation in mainland China

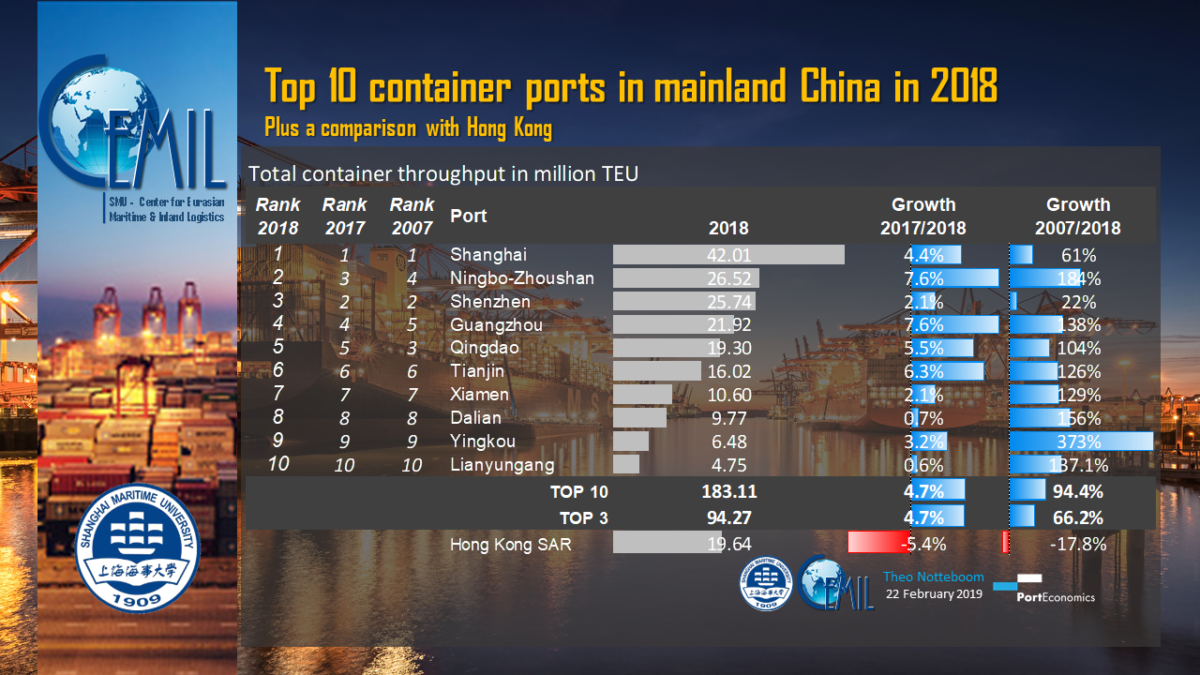
The results for Hong Kong are in sharp contrast to the situation in mainland China: Hong Kong now handles almost 18% fewer boxes compared to 2007 and -5.4% compared to 2017. Only 25 years ago, Hong Kong acted as the only container gateway to China. In May 1980, the Chinese government established the Shenzhen Special Economic Zone, the first special economic zone in China. By the late 1980s, mainland Chinese ports in the Pearl River Delta, such as Shenzhen and Guangzhou, saw the first fruits of this opening up policy. The Pearl River Delta recorded an average annual growth of 19.3% between 1985 and 1995. In the ten following years the Delta’s growth remained high with traffic increases of between 12 and 13% per year. However, Hong Kong did not manage to record a healthy container growth in the past five years. As a result, Shenzhen and Guangzhou have now overtaken Hong Kong in terms of container throughput.

Next article The Analyst: ships and terminals through Amazon's eyes
Previous article Port automation: a paradox for the shipping industry

Theo Notteboom

Dr. Theo Notteboom is co-founder and co-director of PortEconomics. He is a professor in port and maritime economics and management with about 25 years of experience in this area. His work is widely cited. He is a regular speaker at international conferences and a rapporteur/expert to leading organizations in the field. He is Chair Professor at Ghent University in Belgium. He is a visiting Research Professor at China Institute of FTZ Supply Chain of Shanghai Maritime University. He also is part-time Professor at University of Antwerp and the Antwerp Maritime Academy in Belgium. He previously held a full-time position as High-end Foreign Expert / Professor at Dalian Maritime University in China (2014-2016) and an MPA visiting professorship in port management at Nanyang Technological University (NTU) in Singapore. He is immediate past President (2010-2014) and Council Member of International Association of Maritime Economists (IAME). Between October 2006 and October 2014 he was President of ITMMA of the University of Antwerp. Between 2009 and 2014 he was Chairman of the Board of Directors of Belgian Institute of Transport Organizers (BITO), an institute of the Belgian Federal Government.

Related Posts

Geopolitical risks and port-related carbon emissions: evidence and policy implications Category

Geopolitical risks and port-related carbon emissions: evidence and policy implications

Portgraphic: Top-15 EU container ports in H1 2025 Containers

Portgraphic: Top-15 EU container ports in H1 2025

Portgraphic: fleet capacity (owned/chartered) of container shipping lines Containers

Portgraphic: fleet capacity (owned/chartered) of container shipping lines

Weekly Timeline
Oct 5th 7:23 PM
Category

Geopolitical risks and port-related carbon emissions: evidence and policy implications

Oct 2nd 12:27 PM
Thematic Area

Portgraphic: Top-15 EU container ports in H1 2025

Sep 18th 3:40 PM
Thematic Area

Portgraphic: fleet capacity (owned/chartered) of container shipping lines

Sep 12th 3:48 PM
Thematic Area

Investments and financing challenges of the EU’s port managing bodies; findings from a comprehensive survey

Aug 12th 2:18 PM
Thematic Area

Port reform: World Bank publishes the third edition of its port reform toolkit

Tweets by @PortEconomics
  • Containers
  • Cruise
  • EPP
  • Ports & COVID-19
  • Back to top
About PortEconomics

PortEconomics is a web-based initiative aiming to advance knowledge exchange on seaport studies. Established by maritime economists affiliated to academic institutions in Belgium, Greece and the Netherlands. It provides freely accessible research, education, information, and network-building material on critical issues of port economics, management and policies.

Additional Information
  • About
  • Login
  • Register
  • Edit Profile
  • Contact us
  • PortProfessionals
  • PortReport Series
  • Terms and Conditions
  • Cookie Policy
© PortEconomics 2025. All rights reserved.
Produced by PortEconomics
Manage Consent
To provide the best experiences, we use technologies like cookies to store and/or access device information. Consenting to these technologies will allow us to process data such as browsing behavior or unique IDs on this site. Not consenting or withdrawing consent, may adversely affect certain features and functions.
Functional Always active
The technical storage or access is strictly necessary for the legitimate purpose of enabling the use of a specific service explicitly requested by the subscriber or user, or for the sole purpose of carrying out the transmission of a communication over an electronic communications network.
Preferences
The technical storage or access is necessary for the legitimate purpose of storing preferences that are not requested by the subscriber or user.
Statistics
The technical storage or access that is used exclusively for statistical purposes. The technical storage or access that is used exclusively for anonymous statistical purposes. Without a subpoena, voluntary compliance on the part of your Internet Service Provider, or additional records from a third party, information stored or retrieved for this purpose alone cannot usually be used to identify you.
Marketing
The technical storage or access is required to create user profiles to send advertising, or to track the user on a website or across several websites for similar marketing purposes.
Manage options Manage services Manage {vendor_count} vendors Read more about these purposes
View preferences
{title} {title} {title}