


By
Ricardo J. Sánchez[1] & Eliana P. Barleta[2]
Why the ranking?
Although sometimes different numbers are used, it is known that maritime transport accounts for around 80% of world trade in goods in terms of volume and 70% of its value.
Latin America represents approximately 7% of this sum, with a high component of raw materials of mineral and vegetable origin, and foodstuffs of all kinds. The international trade of the region is directly connected to the three main world maritime routes: Europe, North America and Asia, with a growing participation of the latter.
The ranking of ports and container terminals in Latin America (in this case, the top 20) represented 84% of the total throughput of the region in 2022. It is useful not only to follow up the volumes mobilised but also to have a historical perspective of the dynamism of the port activity and the changes observed year after year.
Also, being able to have this information as soon as the previous year has ended adds value to its use for positioning and planning purposes.
Likewise, it is possible to observe an initial classification between those that are mainly transhipment, and function as a logistics hub, and those that operate more local cargo. However, it is beginning to be observed that transhipment is also being re-profiled. Although transhipment is traditionally typical of the Caribbean, where it represents a high percentage of the total operated in the year (for example, Panama, Bahamas, and Jamaica are around 90% and in some individual cases exceed that figure), in the last few years the cases of Montevideo, Santos and El Callao stand out, and little by little they are also acquiring that characteristic. In the last 5 years, Montevideo has varied between 52% and 59% of its throughput in transhipment; El Callao between 18% and 25% and Santos between 34% and 39%. The authors estimate that El Callao could approach 2024, with transhipment operations only, the throughput of the port of Valparaiso.
The top 20 ranking of the ports or port areas of Latin America
The top 20 ranking of Latin American ports or port areas for the comparative period 2019-2023, in TEUs, is presented below.
Only in some cases has it been necessary to estimate the total for the year, as indicated in the table, based on actual activity known up to September (Guayaquil, Fifth Region of Chile and Buenaventura, and November (Moín).
Ranking 2023 Latin America. Top 20 ports or port areas according to throughput
| # | Name, location | Throughput, in ‘000 TEU | Change | |||||||
| Port/terminal | Country | 2019 | 2020 | 2021 | 2022 | 2023 | 2023/2022 | 2023/2019 | ||
| 1 | Panama Caribbean (Colon area) | Panama | 4379 | 4455 | 4916 | 5103 | 4869 | -4,6% | 11,2% | |
| 2 | Santos | Brazil * | 4165 | 4232 | 4443 | 4451 | 4284 | -3,8% | 2,9% | |
| 3 | Manzanillo | Mexico Pacific | 3069 | 2910 | 3371 | 3474 | 3699 | 6,5% | 20,5% | |
| 4 | Panama Pacific | Panama | 2899 | 3162 | 3563 | 3349 | 3370 | 0,6% | 16,3% | |
| 5 | Cartagena Bay | Colombia | 2932 | 3127 | 3344 | 3141 | 3299 | 5,0% | 12,4% | |
| 6 | El Callao (all terminals) | Peru | 2314 | 2251 | 2486 | 2461 | 2703 | 9,8% | 16,8% | |
| 7 | Guayaquil (all terminals) | Ecuador | 2074 | 2071 | 2163 | 2170 | 2254 | ** | 3,9% | 8,7% |
| 8 | Lázaro Cárdenas | Mexico Pacific | 1319 | 1064 | 1686 | 2027 | 1869 | -7,8% | 41,7% | |
| 9 | San Antonio | Chile | 1706 | 1557 | 1840 | 1683 | 1575 | -6,4% | -7,7% | |
| 10 | Moin/Limon complex | Costa Rica | 1247 | 1213 | 1319 | 1321 | 1366 | ** | 3,4% | 9,6% |
| 11 | Buenos Aires, Metropolitan area | Argentina *** | 1485 | 1372 | 1446 | 1360 | 1279 | -4,9% | -13,0% | |
| 12 | Itajaí-Navegantes | Brazil | 1235 | 1273 | 1610 | 1493 | 1268 | -15,1% | 2,6% | |
| 13 | Paranaguá | Brazil | 865 | 925 | 1044 | 1114 | 1186 | 6,5% | 37,1% | |
| 14 | Veracruz | Mexico Gulf | 1144 | 1006 | 1165 | 1187 | 1148 | -3,2% | 0,4% | |
| 15 | Montevideo | Uruguay | 750 | 765 | 978 | 1085 | 1125 | 3,7% | 50,1% | |
| 16 | São Francisco do Sul, Itapoá | Brazil | 735 | 713 | 816 | 886 | 1066 | 20,3% | 45,0% | |
| 17 | Buenaventura (all terminals) | Colombia | 1453 | 1019 | 1083 | 1211 | 1061 | ** | -12,4% | -26,9% |
| 18 | Altamira+Tampico | Mexico Gulf | 889 | 777 | 902 | 878 | 886 | 0,9% | -0,3% | |
| 19 | Valparaiso | Chile | 905 | 735 | 793 | 803 | 785 | ** | -2,2% | -13,2% |
| 20 | Puerto Cortés | Honduras | 644 | 551 | 701 | 769 | 753 | -2,1% | 16,9% |
Note: * Includes Santos, all terminals and DP World. ** Estimated. *** Includes Dock Sud, La Plata and Puerto Nuevo.
Source: Ricardo J. Sánchez & Eliana P. Barleta, based on data obtained from port authorities and operators.
The last two columns of the table show the variations for each port in 2023, compared to two time horizons: the previous year, 2022, and the medium term, in this case, the pre-pandemic. As can be seen briefly, the results are varied. Based on this data, the following two figures show the ups and downs represented by the variation of behaviour in terms of variation of port activity, even within the 20 largest ports of the Latin American region.
Ordered variation of throughput in the Top 20-2023 ranking, compared to 2022 and pre-pandemic
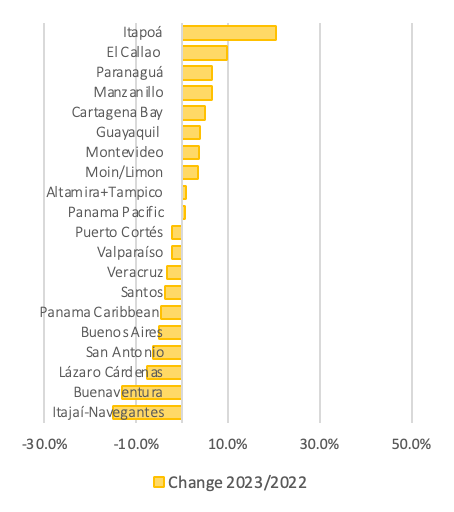
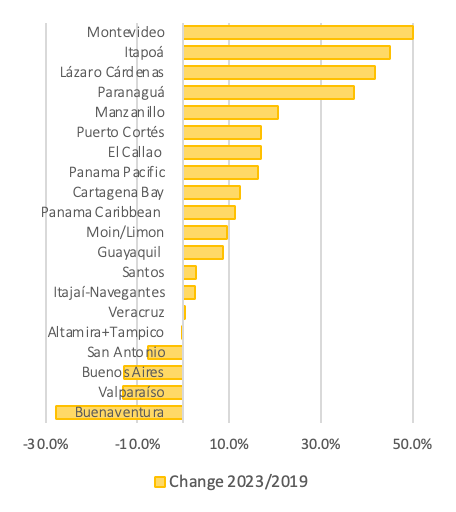
Source: Ricardo J. Sánchez & Eliana P. Barleta, based on data obtained from port authorities and operators.
The undercutting game is evident when the variations in activity are ordered, and the two graphs are arranged in parallel and with the same proportions. One can see the mixed reality within the Top 20, especially in the 2022 performance, but also in the medium term. Note that half of the sample has a positive variation and the other half a negative variation. Only two ports go into double digits of growth (Itapoá and El Callao), whilst at the other extreme, two ports also fall into double digits.
Regarding the medium term, the best performance is led by Montevideo. At the same time, Itapoá, Lázaro Cárdenas and Paranaguá exceed 30% growth, and Manzanillo, Puerto Cortés, El Callao, Panama and Cartagena are in double digits. Buenaventura, Buenos Aires, San Antonio, and Valparaiso perform poorly in terms of comparative growth.
The main winners in both time horizons are El Callao, Montevideo, Itapoá, Paranaguá, Cartagena, Panama Pacifico, Manzanillo (Mexico) and Moín.
Ranking according to throughput by individual economic units in Latin America
Finally, the ranking of individual economic units, defined as those companies operating individually in each Latin American container port, is presented. The selection criterion for the table is those that exceeded one million TEUs in the year.
Ranking 2023 Latin America: the “millionaires”.
Individual companies in a port handling more than 1 million TEUs.
| Port, country | Terminal | Throughput 2023, ´000 TEU |
| Cartagena, Colombia | GPC | 3297 |
| Panama | MIT | 2622 |
| Panama | Balboa | 2313 |
| Manzanillo, Mexico | SSA | 1703 |
| Santos, Brazil | Santos Brasil | 1692 |
| El Callao, Peru | DPW | 1642 |
| Santos, Brazil | BTP | 1545 |
| Panama | CCT | 1358 |
| Moin, Costa Rica | APMT | 1294 |
| Manzanillo, Mexico | Contecon | 1275 |
| Navegantes, Brazil | Portonave | 1268 |
| Paranaguá, Brazil | TCP | 1166 |
| Veracruz, Mexico | ICAVE | 1148 |
| Lázaro Cárdenas, Mexico | HPH | 1122 |
| El Callao, Peru | APMT | 1115 |
| Itapoá, Brazil | Terminais Portuários | 1066 |
| Panama | Rodman | 1057 |
| San Antonio, Chile | STI | 1001* |
Note: * estimated.
Source: Ricardo J. Sánchez & Eliana P. Barleta, based on data obtained from port authorities and operators.
[1] Co-chair, Kühne Professorial Chair in Logistics, School of Management, Universidad de los Andes, Colombia [email protected]
[2] Ph.D. Student in Maritime Studies, University of Piraeus [email protected]