


By Theo Notteboom
Discussions on port development, planning and competitiveness often tend to revolve around container flows. Quite a few ports around the world have developed some kind of ‘container fetish’, implying they have developed a very strong focus on container throughput. But how dependent are ports on container traffic?
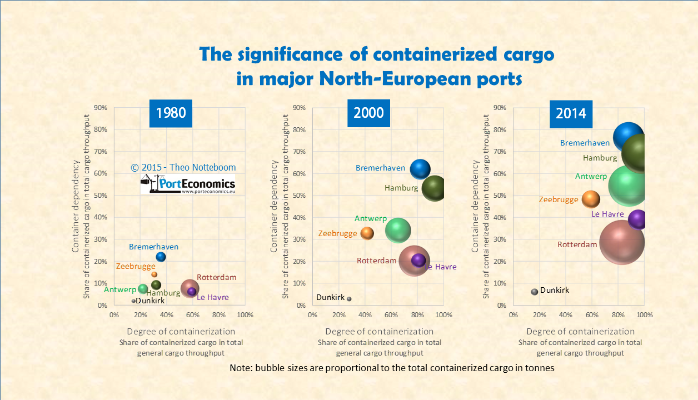
The infographic shows the evolution in some of the main north-European container ports. Three dimensions are presented. The vertical axis shows the container dependency or the share of container throughput in the total throughput of the port. The horizontal axis depicts the degree of containerization or the share of containerized cargo in the total general cargo traffic of the port (i.e. total traffic minus liquid and dry bulk traffic). The size of the bubbles is proportional to the containerized cargo volume expressed in tonnes. The graphs below give a more detailed picture of the evolution of the container dependency and the degree of containerization in the respective ports for the period 1980-2014. Other ports in the region such as Amsterdam, Zeeland Seaports, Ghent and Wilhelmshaven were not listed given very low container traffic figures during the period of observation.
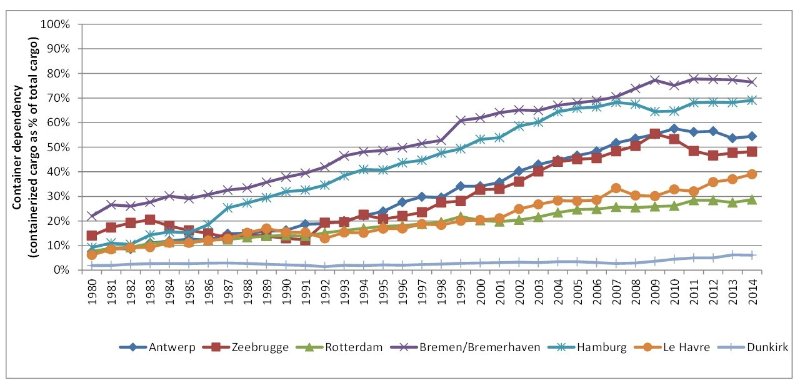
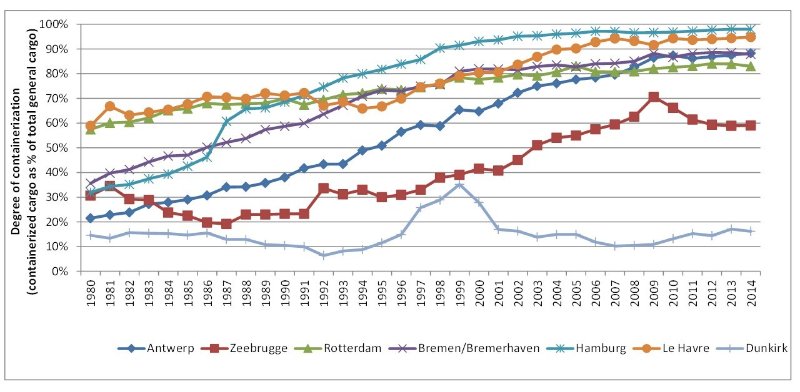
The graphs reveal that the path to increased containerization has not been the same in all ports. Rotterdam and Le Havre have always combined a high degree of containerization with a rather low container dependency. The German ports of Bremen/Bremerhaven and Hamburg have the highest container dependency. They have gone through a strong growth phase in the degree of containerization during the 1980s. At present, almost all general cargo in Hamburg is containerized. The Belgian coastal port of Zeebrugge witnessed a gradual but rather volatile increase in the importance of container traffic. Antwerp, Europe’s largest port in conventional general/breakbulk cargo, saw a very steep rise of the degree of containerization from about 21.5% in 1980 to an elevated 88.3% in 2014. The containerization of conventional general cargo and commodities such as tobacco, coffee, cacao and bananas is one of the factors behind the growth of containerization. Except for Zeebrugge and Dunkirk, all large container ports have reached containerization degrees in excess of 80%. Since almost all break bulk cargo that could be containerized (i.e. in terms of dimensions, weights, etc.) has been containerized, this substitution process is essentially near to completion, except for increasing flows of bulky commodities that are still in the process of being containerized.
The economic crisis made a number of ports to refocus on other cargo flows while not ignoring containerized cargo. For example, several ports such as Antwerp have witnessed strong traffic growth in oil products in recent years following the increasing role of traders in this line of business and the associated development of additional large-scale tank storage capacity. Many ports have developed a strong interest in project cargo, the offshore industry, the recycling business, and biomass and other renewable energy (e.g. ports acting as key nodes in the construction process of large-scale windmill farms on land and in the sea). Are these signs that ports’ container fetish might become somewhat weaker in the years to come?
For further information on the containerization of commodities: Rodrigue, J.-P., Notteboom, T. (2014), Looking inside the box: evidence from the containerization of commodities and the cold chain. Maritime Policy and Management, vol. 42, no. 3, pp. 207-227.