


 By Thanos Pallis and Theo Notteboom
What happened in the major container ports in Europe and US in 2016? Have the trends been similar? What have been the long-term trends, i.e. when comparing last year’s volumes with those recorded the pre-crisis year 2007?
While several indicators related to logistics performance, sustainability, innovation and economic impact are gaining ground, the cargo volumes handled remain a key performance indicator for ports, worth to be studied.
Our PortGraphic presents the top-10 container ports in the European Union and the US in 2016, based on container throughput expressed in .000 TEUs. It also includes container growth figures compared to 2015 and 2007.
In 2016 the top-10 US ports handled a total of 39.2 m. TEUs. The top-10 European ports handled a total of 59,6 m. TEUs.
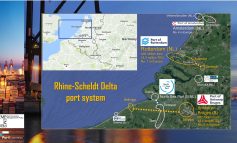
In total three ports, two in Europe, i.e. Rotterdam and Antwerp, and one in the US, the LA/Long Beach complex in the US handled over 10 million TEUs within the last year.
In Europe one can also find 3 more ports handling more than 5 m. TEUs, and three other ports having a container throughput that exists 3 m. TEUs. The respective numbers in the US stand at one and ports respectively.
Year on Year Growth: 2016 vs 2015
The comparison of last year’s trends suggests that 2016 has been a year of similarities. Year-on-Year increase in container traffic in top-10 European ports reached 2% in 2016 slightly more than the 1,8% growth observed in the top-10 US container ports.
The deviation from the average growth is notably higher in European ports than in the US ports
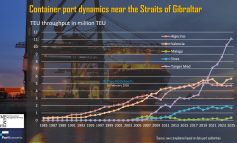
The deviation from this average though is notably higher in Europe than in the US. Four out of 10 European major ports recorded an annual variation that is higher than 5% – Gioa-Tauro (9,8%), Piraeus (9,4%), and Algeciras (5,5%) that gained traffic, and Felixstowe that lost traffic (-7,4%) within 2016. On the other hand, only Savannah (7,2%) recorded a growth that stands at more than 5% comparing to 2015.
Overall, comparing the increase of volumes the last decade, the recovery and dynamism observed since 2007 in the major US container ports are still missing in the case of the top European ones.
Growth 2007/2016
US top-10 container ports recorded a remarkable growth the last decade, standing at 49,9%. This growth is distributed in a rather balanced way between almost all ports of the list, with the exemption of Norfolk. Savannah (+78,9%) has experienced the major growth of all, Charleston (+38,7%) is the one lagging comparatively to the others, yet we see a balanced picture at the major West coast and East coast ports. Norfolk has seen a decline comparing to 2007, standing at -4,1%.
In Europe the growth of top-10 container ports has been slower, and far more unbalanced. The top-10 European ports combined recorded a rather unimpressive 14.1% increase in container traffic compared to pre-crisis year 2007. Also the growth has been anything than balanced: the European top-10 list contains two new entries – Piraeus (+167,7%), and Marsaxlokk (+62,1%), where there is no new entry in the respective US list.
In each case, in nearly a decade, one of the 10 ports recorded in 2016 container volumes that still remain below the 2007 figures.
Overall, comparing the increase of volumes the last decade, the recovery and dynamism observed since 2007 in the major US container ports are still missing in the case of the top European ones.