• Home
  • About
    • Members
    • Associate Members
    • Former members
  • Thematic Areas
    • Containers
    • Cruise
    • European Port Policy
    • Ports & COVID-19
  • PortStudies
  • Presentations
  • Noticeboard
  • Viewpoints
  • PortLibrary
  • PortReport
PortEconomics
  • October 17th, 2025
PortEconomics
  • Home
  • About
    • Members
    • Associate Members
    • Former members
  • Thematic Areas
    • Containers
    • Cruise
    • European Port Policy
    • Ports & COVID-19
  • PortStudies
    Geopolitical risks and port-related carbon emissions: evidence and policy implications

    Geopolitical risks and port-related carbon emissions: evidence and policy implications

    Investments and financing challenges of the EU’s port managing bodies; findings from a comprehensive survey

    Investments and financing challenges of the EU’s port managing bodies; findings from a comprehensive survey

    Evaluating customer satisfaction with clearing and forwarding agents:  Kuwait Shuwaikh Port

    Evaluating customer satisfaction with clearing and forwarding agents: Kuwait Shuwaikh Port

    Digital technologies for efficient and resilient sea-land logistics

    Digital technologies for efficient and resilient sea-land logistics

    Stakeholders’ attitudes toward container terminal automation

    Stakeholders’ attitudes toward container terminal automation

  • Presentations
    Port reform: World Bank publishes the third edition of its port reform toolkit

    Port reform: World Bank publishes the third edition of its port reform toolkit

    When will we admit that maritime transport will not be decarbonised by 2050?

    When will we admit that maritime transport will not be decarbonised by 2050?

    Digital technologies for efficient and resilient sea-land logistics

    Digital technologies for efficient and resilient sea-land logistics

    The World Ports Tracker in TOC Europe

    The World Ports Tracker in TOC Europe

    Newly-upgraded IAPH World Ports Tracker identifies major sustainability and market trends

    Newly-upgraded IAPH World Ports Tracker identifies major sustainability and market trends

  • Noticeboard
    Portgraphic: Top-15 EU container ports in H1 2025

    Portgraphic: Top-15 EU container ports in H1 2025

    PhD posts in the area of ports and energy transition

    PhD posts in the area of ports and energy transition

    PortEconomics members among best-performing scholars globally

    PortEconomics members among best-performing scholars globally

    Accessibility or connectivity: why is it correct to say that in the Caribbean the main logistics problem is connectivity?

    Accessibility or connectivity: why is it correct to say that in the Caribbean the main logistics problem is connectivity?

    Cruise Port-City Compass

    Cruise Port-City Compass

  • Viewpoints
    Portgraphic: Top-15 EU container ports in H1 2025

    Portgraphic: Top-15 EU container ports in H1 2025

    Portgraphic: fleet capacity (owned/chartered) of container shipping lines

    Portgraphic: fleet capacity (owned/chartered) of container shipping lines

    In a tight spot: American ports in global supply chains

    In a tight spot: American ports in global supply chains

    Cruise industry in 2025 at a glance

    Cruise industry in 2025 at a glance

    The box that makes the world go around: container terminals and global trade

    The box that makes the world go around: container terminals and global trade

  • PortLibrary
  • PortReport
PortGraphic: the spectacular rise of Shanghai as a container portContainers

PortGraphic: the spectacular rise of Shanghai as a container port

March 3rd, 2017 Containers, Featured, Presentations

READ ALSO

Portgraphic: Top-15 EU container ports in H1 2025
Portgraphic: fleet capacity (owned/chartered) of container shipping lines
Evaluating customer satisfaction with clearing and forwarding agents:  Kuwait Shuwaikh Port
Evaluating customer satisfaction with clearing and forwarding agents: Kuwait Shuwaikh Port
Geopolitical risks and port-related carbon emissions: evidence and policy implications

theo

By Theo Notteboom

Shanghai was a latecomer in the container business: its first container terminal was opened in 1983

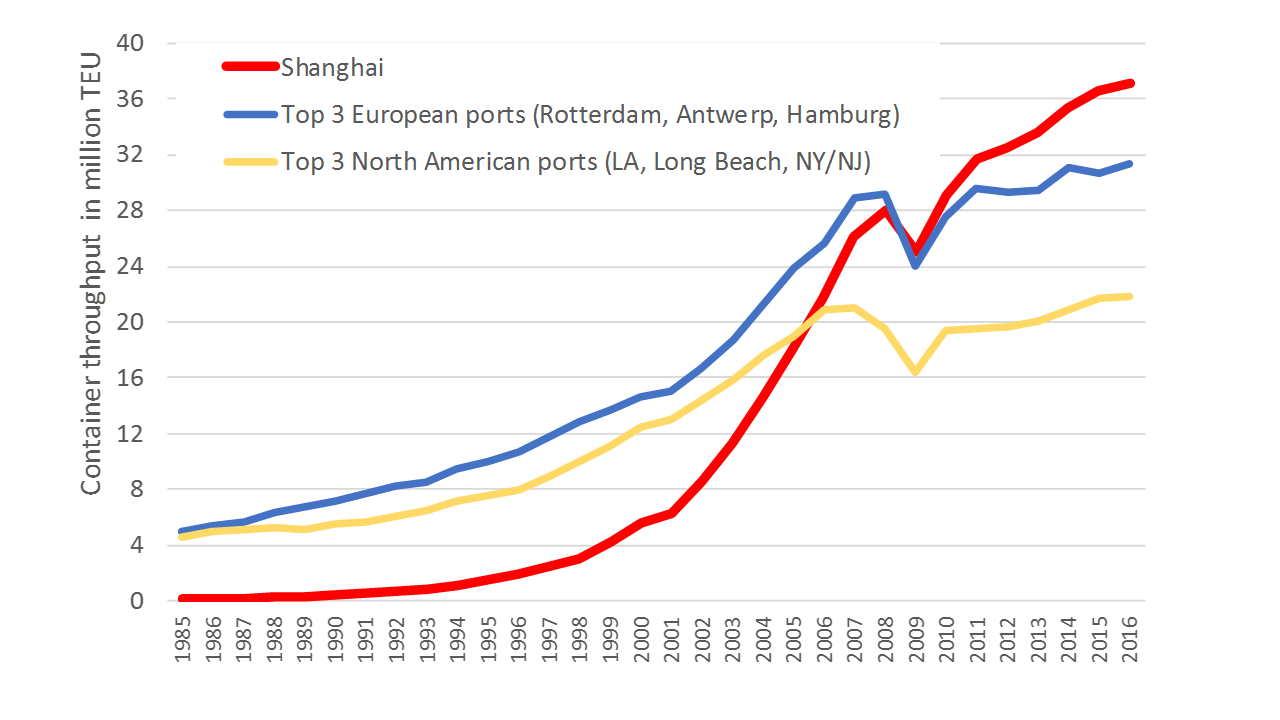
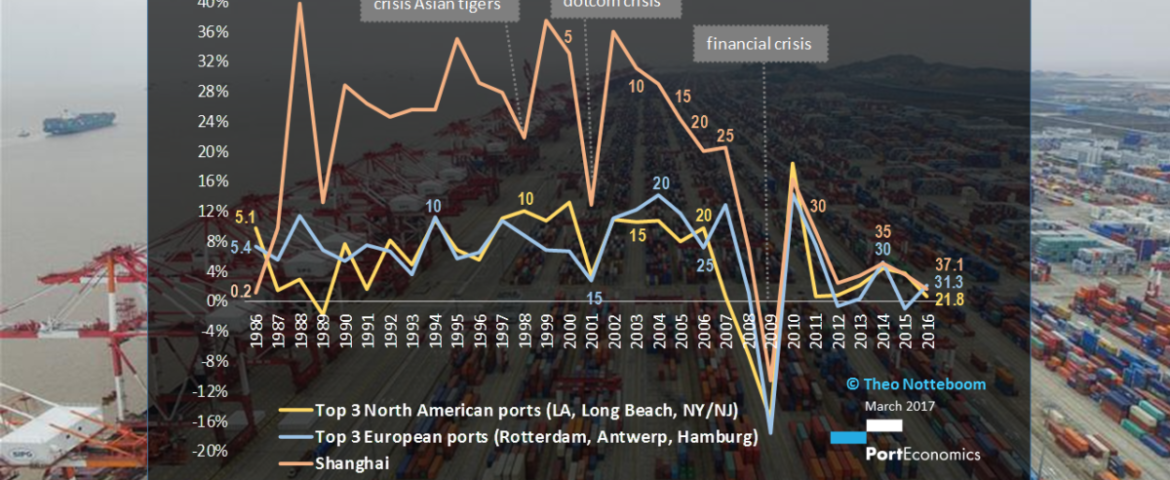
The Portgraphic shows Shanghai’s year-on-year growth in container throughput compared to the top three container ports in Europe (i.e. Rotterdam, Antwerp and Hamburg) and the top three container ports in North America (i.e. Los Angeles, Long Beach and New York/New Jersey).The period of observation starts in 1986. The top three European ports started to receive containers shortly after the launch of the first trans-Atlantic service of Sea-Land in 1966. By 1986, the combined volume of the top three ports in Europe (and in North America) already surpassed 5 million TEU while Shanghai had a very modest volume of some 200,000 TEU. Shanghai was a latecomer in the container business: its first container terminal was opened in 1983 and located at the Huang Pu River, a tributary river of the Yangtze passing through Shanghai’s city centre. Baoshan was the first terminal located along the Yangtze River.

Y-o-y growth rates of 20% to 40% in the 1990s and the early 2000s

The port of Shanghai experienced a spectacular annual TEU growth of between 20% and 40% throughout the 1990s, while the top ports in North America and Europe saw more modest growth figures of up to 11%. Shanghai’s throughput reached 5.6 million TEU in 2000 or 27 times more than in 1986. The favourable policy to turn Shanghai into an international shipping center, the opening up of China and China’s accession to the WTO all meant that growth remained at the same very high level between 2000 and 2007. Only the dotcom crisis in 2001 led to a growth of ‘only’ 13%. Since the mid-1990s, the steep rise in demand led to the development of a series of new terminals in the Waigaoqiao area in the Pudong district at the south bank of the Yangtze estuary and northeast of the city centre. Phases 4 and 5 of the Waigaoqiao development involved the opening of the Shanghai East Container terminal (SECT) in 2002 and the Shanghai Mingdong Container Terminal (SMCT) in 2005. By 2006, Shanghai’s volume already reached 21.7 million TEU, thereby surpassing the combined volume of the top three North American ports . Shanghai’s steep growth curve meant that the port needed only three years to move from 5 to 10 million TEU, another three years to pass the 20 million TEU mark and only one year to move from 21.7 million TEU in 2006 to 26.1 million TEU in 2007. To put things in perspective, Shanghai’s TEU growth in 2007 was similar to what the ports of Algeciras and Valencia (i.e. Europe’s no. 5 and 6 in volume terms) each handled throughout the year 2016.

Yang Shan, an offshore terminal complex providing much needed deep water capacity

Already in 1998, the Shanghai port authority came to the conclusion that the terminals along the Yangtze river were not sufficient to accommodate future growth. Furthermore, the maximum draft of 14.2m at the Waigaoqiao terminals started to become a constraint in dealing with the ever larger container vessels. In the end, Yang Shan, a group of small islands located at the mouth of the Hangzhou Bay, was chosen as the location for a new massive offshore terminal complex connected to the mainland via the newly constructed Donghai road bridge with a length of 31.5km. The first phase of the Yang Shan complex was opened in 2004 with a capacity of some 2.2 million TEU. Three more phases followed. Phase 4 will be completed this year and will add some 4 million TEU to the already impressive terminal capacity of Yang Shan. The offshore complex of Yang Shan gave Shanghai much needed deep water terminal facilities to accommodate growing demand.

More modest growth in the past few years

The financial crisis made an end to Shanghai’s spectacular rise as the world’s number one container port. The port’s volumes dropped 11% in 2009, compared to -17.6% in the top three European ports and -15.9% in the top three North American ports. While Shanghai continued its growth path after the dramatic year 2009, the recorded growth rates became much lower than before the crisis. Since 2012 the port’s annual growth in container throughput even remained below 5% with 2016 showing a very modest rise of 1.6%. In other words, Shanghai’s growth path is more and more in line with the modest traffic development observed in the top North American and European ports. Even at these more modest growth rates, Shanghai managed to add 11 million TEU to its container volume between pre-crisis year 2007 and 2016. Last year the Yangtze port recorded a total throughput of 37.1 million TEU thereby strengthening its position as the world’s busiest container port. In comparison, the top three north American ports only added 0.87 million TEU to their volume base in the period 2007-2016 to reach 21.8 million TEU in 2016, while the top three European ports recorded a growth of 2.47 million TEU in the same period to end up with 31.3 million TEU in 2016.

Shanghai container throuput


Next article A taxonomy of logistics centres: overcoming conceptual ambiguity
Previous article Improving cruise port infrastructure in the Med

Theo Notteboom

Dr. Theo Notteboom is co-founder and co-director of PortEconomics. He is a professor in port and maritime economics and management with about 25 years of experience in this area. His work is widely cited. He is a regular speaker at international conferences and a rapporteur/expert to leading organizations in the field. He is Chair Professor at Ghent University in Belgium. He is a visiting Research Professor at China Institute of FTZ Supply Chain of Shanghai Maritime University. He also is part-time Professor at University of Antwerp and the Antwerp Maritime Academy in Belgium. He previously held a full-time position as High-end Foreign Expert / Professor at Dalian Maritime University in China (2014-2016) and an MPA visiting professorship in port management at Nanyang Technological University (NTU) in Singapore. He is immediate past President (2010-2014) and Council Member of International Association of Maritime Economists (IAME). Between October 2006 and October 2014 he was President of ITMMA of the University of Antwerp. Between 2009 and 2014 he was Chairman of the Board of Directors of Belgian Institute of Transport Organizers (BITO), an institute of the Belgian Federal Government.

Related Posts

Geopolitical risks and port-related carbon emissions: evidence and policy implications Category

Geopolitical risks and port-related carbon emissions: evidence and policy implications

Portgraphic: Top-15 EU container ports in H1 2025 Containers

Portgraphic: Top-15 EU container ports in H1 2025

Portgraphic: fleet capacity (owned/chartered) of container shipping lines Containers

Portgraphic: fleet capacity (owned/chartered) of container shipping lines

Weekly Timeline
Oct 5th 7:23 PM
Category

Geopolitical risks and port-related carbon emissions: evidence and policy implications

Oct 2nd 12:27 PM
Thematic Area

Portgraphic: Top-15 EU container ports in H1 2025

Sep 18th 3:40 PM
Thematic Area

Portgraphic: fleet capacity (owned/chartered) of container shipping lines

Sep 12th 3:48 PM
Thematic Area

Investments and financing challenges of the EU’s port managing bodies; findings from a comprehensive survey

Aug 12th 2:18 PM
Thematic Area

Port reform: World Bank publishes the third edition of its port reform toolkit

Tweets by @PortEconomics
  • Containers
  • Cruise
  • EPP
  • Ports & COVID-19
  • Back to top
About PortEconomics

PortEconomics is a web-based initiative aiming to advance knowledge exchange on seaport studies. Established by maritime economists affiliated to academic institutions in Belgium, Greece and the Netherlands. It provides freely accessible research, education, information, and network-building material on critical issues of port economics, management and policies.

Additional Information
  • About
  • Login
  • Register
  • Edit Profile
  • Contact us
  • PortProfessionals
  • PortReport Series
  • Terms and Conditions
  • Cookie Policy
© PortEconomics 2025. All rights reserved.
Produced by PortEconomics
Manage Consent
To provide the best experiences, we use technologies like cookies to store and/or access device information. Consenting to these technologies will allow us to process data such as browsing behavior or unique IDs on this site. Not consenting or withdrawing consent, may adversely affect certain features and functions.
Functional Always active
The technical storage or access is strictly necessary for the legitimate purpose of enabling the use of a specific service explicitly requested by the subscriber or user, or for the sole purpose of carrying out the transmission of a communication over an electronic communications network.
Preferences
The technical storage or access is necessary for the legitimate purpose of storing preferences that are not requested by the subscriber or user.
Statistics
The technical storage or access that is used exclusively for statistical purposes. The technical storage or access that is used exclusively for anonymous statistical purposes. Without a subpoena, voluntary compliance on the part of your Internet Service Provider, or additional records from a third party, information stored or retrieved for this purpose alone cannot usually be used to identify you.
Marketing
The technical storage or access is required to create user profiles to send advertising, or to track the user on a website or across several websites for similar marketing purposes.
Manage options Manage services Manage {vendor_count} vendors Read more about these purposes
View preferences
{title} {title} {title}