• Home
  • About
    • Members
    • Associate Members
    • Former members
  • Thematic Areas
    • Containers
    • Cruise
    • European Port Policy
    • Ports & COVID-19
  • PortStudies
  • Presentations
  • Noticeboard
  • Viewpoints
  • PortLibrary
  • PortReport
PortEconomics
  • October 18th, 2025
PortEconomics
  • Home
  • About
    • Members
    • Associate Members
    • Former members
  • Thematic Areas
    • Containers
    • Cruise
    • European Port Policy
    • Ports & COVID-19
  • PortStudies
    Geopolitical risks and port-related carbon emissions: evidence and policy implications

    Geopolitical risks and port-related carbon emissions: evidence and policy implications

    Investments and financing challenges of the EU’s port managing bodies; findings from a comprehensive survey

    Investments and financing challenges of the EU’s port managing bodies; findings from a comprehensive survey

    Evaluating customer satisfaction with clearing and forwarding agents:  Kuwait Shuwaikh Port

    Evaluating customer satisfaction with clearing and forwarding agents: Kuwait Shuwaikh Port

    Digital technologies for efficient and resilient sea-land logistics

    Digital technologies for efficient and resilient sea-land logistics

    Stakeholders’ attitudes toward container terminal automation

    Stakeholders’ attitudes toward container terminal automation

  • Presentations
    Port reform: World Bank publishes the third edition of its port reform toolkit

    Port reform: World Bank publishes the third edition of its port reform toolkit

    When will we admit that maritime transport will not be decarbonised by 2050?

    When will we admit that maritime transport will not be decarbonised by 2050?

    Digital technologies for efficient and resilient sea-land logistics

    Digital technologies for efficient and resilient sea-land logistics

    The World Ports Tracker in TOC Europe

    The World Ports Tracker in TOC Europe

    Newly-upgraded IAPH World Ports Tracker identifies major sustainability and market trends

    Newly-upgraded IAPH World Ports Tracker identifies major sustainability and market trends

  • Noticeboard
    Portgraphic: Top-15 EU container ports in H1 2025

    Portgraphic: Top-15 EU container ports in H1 2025

    PhD posts in the area of ports and energy transition

    PhD posts in the area of ports and energy transition

    PortEconomics members among best-performing scholars globally

    PortEconomics members among best-performing scholars globally

    Accessibility or connectivity: why is it correct to say that in the Caribbean the main logistics problem is connectivity?

    Accessibility or connectivity: why is it correct to say that in the Caribbean the main logistics problem is connectivity?

    Cruise Port-City Compass

    Cruise Port-City Compass

  • Viewpoints
    Portgraphic: Top-15 EU container ports in H1 2025

    Portgraphic: Top-15 EU container ports in H1 2025

    Portgraphic: fleet capacity (owned/chartered) of container shipping lines

    Portgraphic: fleet capacity (owned/chartered) of container shipping lines

    In a tight spot: American ports in global supply chains

    In a tight spot: American ports in global supply chains

    Cruise industry in 2025 at a glance

    Cruise industry in 2025 at a glance

    The box that makes the world go around: container terminals and global trade

    The box that makes the world go around: container terminals and global trade

  • PortLibrary
  • PortReport
PortGraphics: most popular 2016Containers

PortGraphics: most popular 2016

December 30th, 2016 Containers, Viewpoints

READ ALSO

Viewpoints: most popular 2016
PortReport 2016
PortReport 2016
Port Authorities: most popular 2016
Portgraphic: Top-15 EU container ports in H1 2025

PortEconomics is celebrating the ending of 2016 recapping the articles that have captured the interest of the visitors of our web initiative so far for 2016.

Our most popular papers on PortGraphics in 2016 were:

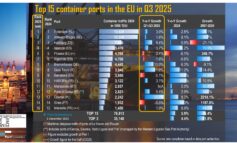
1. PortGraphic: top 15 european container ports in 2015
The PortGraphic of PortEconomics co-director Theo Notteboom shows the top 15 container ports in the European Union in 2015 based on container throughput expressed in TEU. It also includes container growth figures compared to 2014 and pre-crisis year 2007. What can we observe? [Link]

2. PortGraphic: alliances in container shipping-impact of Korean/Japanese carrier dynamics
Since 2015 four alliances are operational in the container shipping market: 2M, Ocean Three, CKY(H)E and G6. The merger of China Shipping and Cosco to form China Cosco Container Lines (COSCOCS) and the acquisition of APL/NOL by CMA CGM were the first major market changes signalling major changes in the current alliance structure. By Q2 of 2017, the new alliance landscape would include the 2M alliance and two new large-scale alliances, i.e. the Ocean Alliance and THE Alliance, comments PortEconomics co-director Theo Notteboom. [Link]

3. PortGraphic: dynamics in alliance formation in container shipping
Alliances are about operational vessel-sharing co-operation between container shipping companies on multiple trade routes (mostly east-west). The first strategic alliances between shipping lines date back to the mid-1990s, a period that coincided with the introduction of the first post-Panamax containers vessels on the Europe-Far East trade. The alliance partnerships evolved as a result of mergers and acquisitions (e.g. merger between P&OCL and Nedlloyd and the take-overs by P&O Nedlloyd and SeaLand by Maersk) and the market entry and exit of liner shipping companies, analyses PortEconomics co-director Theo Notteboom. [Link]

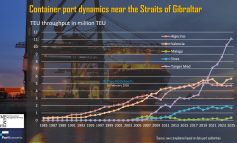
4. PortGraphic: chinese, EU & north american container port regions: 1985-2015
The PortGraphic of PortEconomics co-director Theo Notteboom shows the evolution of container throughput in the three main container port regions in China (i.e. Yangtze River Delta, Pearly River Delta and the Bohai Rim). Theo compares these volume dynamics with some key port systems in North America and Europe: the port system along the North American West Coast including ports such as Seattle/Tacoma, Vancouver, LA, Long Beach and Oakland; East coast ports such as Norfolk, Charleston, New York/New Jersey, Baltimore, Savannah and Halifax; the Hamburg-Le Havre port range consisting of key north-European container ports such as Rotterdam, Antwerp, Hamburg, Bremerhaven, Le Havre, Zeebrugge and Wilhelmshaven; and the West Mediterranean including Med ports in Spain, France, Italy and Malta, and Adriatic ports. [Link]

5. PortGraphic: economic crisis and ports – the Greek case
The Greek economy is going through the eighth year of economic recession as the economic crisis in Greece started at the end of 2008 and continues today. In this environment, Greek ports tried to respond to a series of challenges such as the reduction in consumption in the internal market, the reduction in the competitiveness of the Greek economy as well as some inherent challenges such as the resuction of ports personnel. The PortGraphic of PortEconomics member George Vaggelas outlines how Greek ports (and more specifically the 12 ports operating as Societe Anonymes) performed during this period of economic uncertainty. The analysis is based on the  throughput and economic data official released by the respective port authorities. [Link]

6. PortGraphic: measuring and sharing cruise port users’ perspectives in the Med
Mediterranean cruise ports have gone a long way in measuring the perspectives of their users. PortEconomics members Thanos Pallis and Aimilia Papachristou PortGraphic details a survey of 71 cruise ports in the Med and its adjoining seas, the second biggest cruise region of the world. The PortGraphic reveals that the measurement of users’ satisfaction has turn to a standard practice for most cruise ports. [Link]

Next article Viewpoints: most popular 2016
Previous article PortReport 2016

Related Posts

Portgraphic: Top-15 EU container ports in H1 2025 Containers

Portgraphic: Top-15 EU container ports in H1 2025

Portgraphic: fleet capacity (owned/chartered) of container shipping lines Containers

Portgraphic: fleet capacity (owned/chartered) of container shipping lines

Evaluating customer satisfaction with clearing and forwarding agents:  Kuwait Shuwaikh Port Containers

Evaluating customer satisfaction with clearing and forwarding agents: Kuwait Shuwaikh Port

Weekly Timeline
Oct 5th 7:23 PM
Category

Geopolitical risks and port-related carbon emissions: evidence and policy implications

Oct 2nd 12:27 PM
Thematic Area

Portgraphic: Top-15 EU container ports in H1 2025

Sep 18th 3:40 PM
Thematic Area

Portgraphic: fleet capacity (owned/chartered) of container shipping lines

Sep 12th 3:48 PM
Thematic Area

Investments and financing challenges of the EU’s port managing bodies; findings from a comprehensive survey

Aug 12th 2:18 PM
Thematic Area

Port reform: World Bank publishes the third edition of its port reform toolkit

Tweets by @PortEconomics
  • Containers
  • Cruise
  • EPP
  • Ports & COVID-19
  • Back to top
About PortEconomics

PortEconomics is a web-based initiative aiming to advance knowledge exchange on seaport studies. Established by maritime economists affiliated to academic institutions in Belgium, Greece and the Netherlands. It provides freely accessible research, education, information, and network-building material on critical issues of port economics, management and policies.

Additional Information
  • About
  • Login
  • Register
  • Edit Profile
  • Contact us
  • PortProfessionals
  • PortReport Series
  • Terms and Conditions
  • Cookie Policy
© PortEconomics 2025. All rights reserved.
Produced by PortEconomics
Manage Consent
To provide the best experiences, we use technologies like cookies to store and/or access device information. Consenting to these technologies will allow us to process data such as browsing behavior or unique IDs on this site. Not consenting or withdrawing consent, may adversely affect certain features and functions.
Functional Always active
The technical storage or access is strictly necessary for the legitimate purpose of enabling the use of a specific service explicitly requested by the subscriber or user, or for the sole purpose of carrying out the transmission of a communication over an electronic communications network.
Preferences
The technical storage or access is necessary for the legitimate purpose of storing preferences that are not requested by the subscriber or user.
Statistics
The technical storage or access that is used exclusively for statistical purposes. The technical storage or access that is used exclusively for anonymous statistical purposes. Without a subpoena, voluntary compliance on the part of your Internet Service Provider, or additional records from a third party, information stored or retrieved for this purpose alone cannot usually be used to identify you.
Marketing
The technical storage or access is required to create user profiles to send advertising, or to track the user on a website or across several websites for similar marketing purposes.
Manage options Manage services Manage {vendor_count} vendors Read more about these purposes
View preferences
{title} {title} {title}