• Home
  • About
    • Members
    • Associate Members
    • Former members
  • Thematic Areas
    • Containers
    • Cruise
    • European Port Policy
    • Ports & COVID-19
  • PortStudies
  • Presentations
  • Noticeboard
  • Viewpoints
  • PortLibrary
  • PortReport
PortEconomics
  • October 17th, 2025
PortEconomics
  • Home
  • About
    • Members
    • Associate Members
    • Former members
  • Thematic Areas
    • Containers
    • Cruise
    • European Port Policy
    • Ports & COVID-19
  • PortStudies
    Geopolitical risks and port-related carbon emissions: evidence and policy implications

    Geopolitical risks and port-related carbon emissions: evidence and policy implications

    Investments and financing challenges of the EU’s port managing bodies; findings from a comprehensive survey

    Investments and financing challenges of the EU’s port managing bodies; findings from a comprehensive survey

    Evaluating customer satisfaction with clearing and forwarding agents:  Kuwait Shuwaikh Port

    Evaluating customer satisfaction with clearing and forwarding agents: Kuwait Shuwaikh Port

    Digital technologies for efficient and resilient sea-land logistics

    Digital technologies for efficient and resilient sea-land logistics

    Stakeholders’ attitudes toward container terminal automation

    Stakeholders’ attitudes toward container terminal automation

  • Presentations
    Port reform: World Bank publishes the third edition of its port reform toolkit

    Port reform: World Bank publishes the third edition of its port reform toolkit

    When will we admit that maritime transport will not be decarbonised by 2050?

    When will we admit that maritime transport will not be decarbonised by 2050?

    Digital technologies for efficient and resilient sea-land logistics

    Digital technologies for efficient and resilient sea-land logistics

    The World Ports Tracker in TOC Europe

    The World Ports Tracker in TOC Europe

    Newly-upgraded IAPH World Ports Tracker identifies major sustainability and market trends

    Newly-upgraded IAPH World Ports Tracker identifies major sustainability and market trends

  • Noticeboard
    Portgraphic: Top-15 EU container ports in H1 2025

    Portgraphic: Top-15 EU container ports in H1 2025

    PhD posts in the area of ports and energy transition

    PhD posts in the area of ports and energy transition

    PortEconomics members among best-performing scholars globally

    PortEconomics members among best-performing scholars globally

    Accessibility or connectivity: why is it correct to say that in the Caribbean the main logistics problem is connectivity?

    Accessibility or connectivity: why is it correct to say that in the Caribbean the main logistics problem is connectivity?

    Cruise Port-City Compass

    Cruise Port-City Compass

  • Viewpoints
    Portgraphic: Top-15 EU container ports in H1 2025

    Portgraphic: Top-15 EU container ports in H1 2025

    Portgraphic: fleet capacity (owned/chartered) of container shipping lines

    Portgraphic: fleet capacity (owned/chartered) of container shipping lines

    In a tight spot: American ports in global supply chains

    In a tight spot: American ports in global supply chains

    Cruise industry in 2025 at a glance

    Cruise industry in 2025 at a glance

    The box that makes the world go around: container terminals and global trade

    The box that makes the world go around: container terminals and global trade

  • PortLibrary
  • PortReport
Evolution of containershipsContainers

Evolution of containerships

June 28th, 2016 Containers, Featured, Uncategorized

tuscorlloyds.com

READ ALSO

Port reform: World Bank publishes the third edition of its port reform toolkit
In a tight spot: American ports in global supply chains
The box that makes the world go around: container terminals and global trade
Geopolitical risks and port-related carbon emissions: evidence and policy implications

RodrigueBy Jean-Paul Rodrigue

An updated graph (below) on the evolution of containerships with more detailed ship profiles and a more revealing depiction of the number of containers they can load is available in The Geography of Transport Systems webpage.

Since the beginning of containerization in the mid 1950s, containerships undertook six general waves of changes, each representing new generations of containership:

A) Early containerships. The first generation of containerships was composed of modified bulk vessels or tankers that could transport up 1,000 TEUs. The first containership, the “Ideal-X” was a converted World War II T2 tanker. The container was at the beginning of the 1960s an untested transport technology and reconverting existing ships proved out to be of lower costs and less risky. These ships were carrying onboard cranes since most port terminals were not equipped to handle containers.

They were also relatively slow, with speeds of about 18 to 20 knots and could only carry containers on the converted decks and not in their bellyhold. Once the container began to be massively adopted at the beginning of the 1970s, the construction of the first fully cellular containerships (FCC; second generation) entirely dedicated for handling containers started. All containerships are composed of cells lodging containers in stacks of different height depending on the ship capacity. Cellular containership also offer the advantage of using the whole ship to stack containers, including below deck. Usually an extra of two containers in width can be carried above deck than below deck.

Cranes were removed from the ship design so that more containers could be carried (cranes remain today on some specialized containerships). The ability of ports to handle cellular containerships ceased to be a major concern with the setting of specialized container terminals around the world. Cellular containerships were also much faster with speeds of 20-24 knots, which would become the speed of reference in containerised shipping.

Evolution of containerships

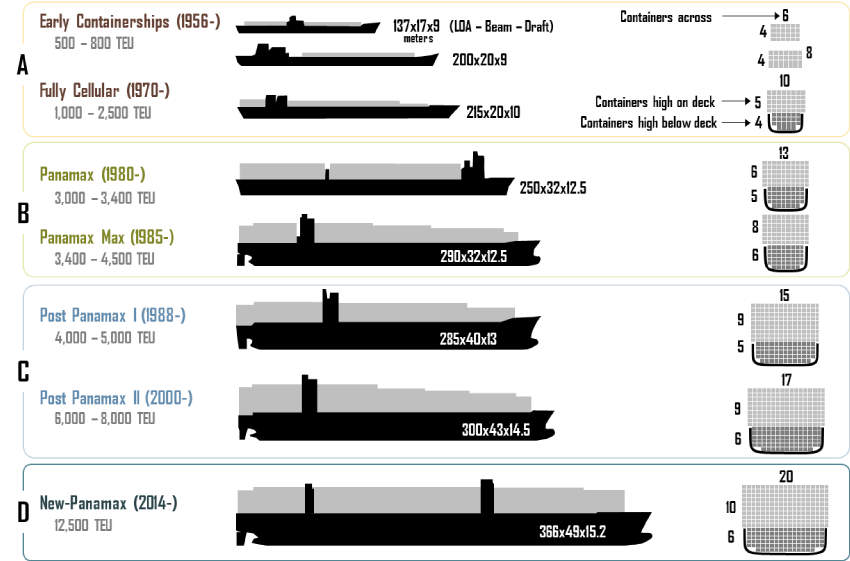
Source: Ashar and Rodrigue, 2012. All dimensions are in meters. LOA: Length overall. The loads displayed on deck represent maximal possible loads, which would involve a large share of empty containers. Containerships usually carry less containers because of weight restrictions and lack of demand.


B) Panamax. During the 1980s economies of scale rapidly pushed for the construction of larger containerships; the larger the number of containers being carried the lower the costs per TEU. The process became a virtuous circle compounding larger volumes and lower costs, which significantly helped the diffusion of the container. The size limit of the Panama Canal, which came to be known as the panamax standard, was achieved in 1985 with a capacity of about 4,000 TEUs.

Once this limit was achieved, a decade passed before a new generation of larger containerships was designed. At the same time panamax container ship designs were evolving to take maximum advantage of the canal’s limitation in beam (Panamax Max). The original dimensions of the Panama Canal, built by the US Army Corps of Engineers, are similar to the dimensions of the US Inland Waterways locks, resulting in a narrow and long ship design.

C) Post Panamax I and II. Going beyond panamax was perceived as a risk in terms of the configuration of shipping networks, additional handling infrastructure as well as draft limitations at ports. The APL C10 containership class, with a capacity of 4,500 TEUs, was introduced in 1988 and was the first containership class to exceeded the 32.2 m width limit of the Panama Canal. By 1996, full fledged Post Panamax containerships were introduced with capacities reaching 6,600 TEUs. The first Post Panamax ship classes where not much longer than the Panamax class, but wider. A ship above the panamax size requires a substantial amount of cargo to be used profitably along a service loop and by the late 1990s the rapid growth of global trade made such a ship class a marketable proposition. Once the panamax threshold was breached, ship size quickly increased with capacities reaching 8,000 TEUs (Post Panamax II; “Sovereign Class”). Post Panamax containerships triggered an infrastructure challenge for many ports since they require deeper drafts (at least 43 feet of draft) and highly efficient, but costly, portainers. Draft constraints became a factor placing pressures on ports to dredge to accommodate post panamax containerships.

D) New-Panamax, or Neo-Panamax (NPX). Refers to ships designed to fit exactly in the locks of the expanded Panama Canal, expected to open in 2016. These ships will have a capacity of about 12,500 TEU. Like its Panamax counterparts, New Panamax ships will define a specific ship class able to effectively service the Americas and the Caribbean, either from Europe or from Asia.

E) Post Panamax III and Triple E. By 2006, a third generation of post panamax containerships came online when Maersk shipping line introduced a ship class having a capacity in the range of 11,000 to 14,500 TEUs; the Emma Maersk, (E Class). They were dubbed “Post New Panamax” since they are bigger than the specifications of the expanded Panama Canal. A further extension of the post panamax design led to the introduction of “Triple E” class ships of about 18,000 TEUs in 2013. It remains to be seen which routes and ports these ships would service, but they are limited mostly to routes between Asia and Europe. There are larger ship designs on the drawing boards, such as the “Malacca Max” class that could carry about 27,000-30,000 TEU, but they are not expected to be constructed within a decade.

Containership speeds have peaked to an average of 20 to 25 knots and it is unlikely that speeds will increase due to energy consumption; many shipping lines are opting for slow steaming to cope with higher bunker fuel prices (when there are market spikes) and overcapacity. The deployment of a class of fast containerships has remained on the drawing boards because the speed advantages they would confer would not compensate for the much higher shipping costs. Supply chains have simply been synchronized with container shipping speeds.

Each subsequent generation of containership is facing a shrinking number of harbors able to handle them and placing pressures on port infrastructure and equipment. Maritime shipping companies are incited to use the largest containerships possible on their shipping routes, since they benefit from economies of scale. However, ports and inland transportation systems have to provide substantial capital investment if they expect to accommodate larger containerships. There are thus operational limitations to deploy ships bigger than 8,000 TEU in terms of ports of call and the required infrastructure to provide an acceptable loading and unloading throughput. Also, large containership deployments require a substantial amount of cargo to be commercially feasible. Containerships in the range of 5,500 to 6,500 TEU appear to be the most flexible in terms of the ports they can access and they market they can service since using larger ships require fewer port calls. Therefore, the limits to economies of scale in container shipping are much more limited by commercial attributes than by technical constraints.

First published in The Geography of Transport Systems

Next article Data into information, and information into insight
Previous article The Panama canal expansion: they dug it, will they come?

JeanPaul Rodrigue

Dr. Jean-Paul Rodrigue received a Ph.D. in Transport Geography from the Université de Montréal (1994) and has been at the Department of Economics & Geography at Hofstra University since 1999. In 2008, he became part of the Department of Global Studies and Geography. Dr. Rodrigue sits on the international editorial board of the Journal of Transport Geography, the Journal of Shipping and Trade and the Cahiers Scientifiques du Transport. He is a board member of the University Transportation Research Center, Region II of the City University of New York and is a lead member of the PortEconomics.eu initiative. Dr. Rodrigue is a member of the World Economic Forum Global Agenda Council on the Future of Manufacturing and a board member of the Canadian Transportation Research Forum as well as of the International Association of Maritime Economists. In 2013, the US Secretary of Transportation appointed Dr. Rodrigue to sit on the Advisory Board of the US Merchant Marine Academy. He is also the New York team leader for the MetroFreight project about city logistics. He regularly performs advisory and consulting assignments for international organizations and corporations.

Related Posts

Geopolitical risks and port-related carbon emissions: evidence and policy implications Category

Geopolitical risks and port-related carbon emissions: evidence and policy implications

Portgraphic: Top-15 EU container ports in H1 2025 Containers

Portgraphic: Top-15 EU container ports in H1 2025

Portgraphic: fleet capacity (owned/chartered) of container shipping lines Containers

Portgraphic: fleet capacity (owned/chartered) of container shipping lines

Weekly Timeline
Oct 5th 7:23 PM
Category

Geopolitical risks and port-related carbon emissions: evidence and policy implications

Oct 2nd 12:27 PM
Thematic Area

Portgraphic: Top-15 EU container ports in H1 2025

Sep 18th 3:40 PM
Thematic Area

Portgraphic: fleet capacity (owned/chartered) of container shipping lines

Sep 12th 3:48 PM
Thematic Area

Investments and financing challenges of the EU’s port managing bodies; findings from a comprehensive survey

Aug 12th 2:18 PM
Thematic Area

Port reform: World Bank publishes the third edition of its port reform toolkit

Tweets by @PortEconomics
  • Containers
  • Cruise
  • EPP
  • Ports & COVID-19
  • Back to top
About PortEconomics

PortEconomics is a web-based initiative aiming to advance knowledge exchange on seaport studies. Established by maritime economists affiliated to academic institutions in Belgium, Greece and the Netherlands. It provides freely accessible research, education, information, and network-building material on critical issues of port economics, management and policies.

Additional Information
  • About
  • Login
  • Register
  • Edit Profile
  • Contact us
  • PortProfessionals
  • PortReport Series
  • Terms and Conditions
  • Cookie Policy
© PortEconomics 2025. All rights reserved.
Produced by PortEconomics
Manage Consent
To provide the best experiences, we use technologies like cookies to store and/or access device information. Consenting to these technologies will allow us to process data such as browsing behavior or unique IDs on this site. Not consenting or withdrawing consent, may adversely affect certain features and functions.
Functional Always active
The technical storage or access is strictly necessary for the legitimate purpose of enabling the use of a specific service explicitly requested by the subscriber or user, or for the sole purpose of carrying out the transmission of a communication over an electronic communications network.
Preferences
The technical storage or access is necessary for the legitimate purpose of storing preferences that are not requested by the subscriber or user.
Statistics
The technical storage or access that is used exclusively for statistical purposes. The technical storage or access that is used exclusively for anonymous statistical purposes. Without a subpoena, voluntary compliance on the part of your Internet Service Provider, or additional records from a third party, information stored or retrieved for this purpose alone cannot usually be used to identify you.
Marketing
The technical storage or access is required to create user profiles to send advertising, or to track the user on a website or across several websites for similar marketing purposes.
Manage options Manage services Manage {vendor_count} vendors Read more about these purposes
View preferences
{title} {title} {title}