• Home
  • About
    • Members
    • Associate Members
    • Former members
  • Thematic Areas
    • Containers
    • Cruise
    • European Port Policy
    • Ports & COVID-19
  • PortStudies
  • Presentations
  • Noticeboard
  • Viewpoints
  • PortLibrary
  • PortReport
PortEconomics
  • September 21st, 2025
PortEconomics
  • Home
  • About
    • Members
    • Associate Members
    • Former members
  • Thematic Areas
    • Containers
    • Cruise
    • European Port Policy
    • Ports & COVID-19
  • PortStudies
    Investments and financing challenges of the EU’s port managing bodies; findings from a comprehensive survey

    Investments and financing challenges of the EU’s port managing bodies; findings from a comprehensive survey

    Evaluating customer satisfaction with clearing and forwarding agents:  Kuwait Shuwaikh Port

    Evaluating customer satisfaction with clearing and forwarding agents: Kuwait Shuwaikh Port

    Digital technologies for efficient and resilient sea-land logistics

    Digital technologies for efficient and resilient sea-land logistics

    Stakeholders’ attitudes toward container terminal automation

    Stakeholders’ attitudes toward container terminal automation

    Toward green container liner shipping: joint optimization of heterogeneous fleet deployment, speed optimization, and fuel bunkering

    Toward green container liner shipping: joint optimization of heterogeneous fleet deployment, speed optimization, and fuel bunkering

  • Presentations
    Port reform: World Bank publishes the third edition of its port reform toolkit

    Port reform: World Bank publishes the third edition of its port reform toolkit

    When will we admit that maritime transport will not be decarbonised by 2050?

    When will we admit that maritime transport will not be decarbonised by 2050?

    Digital technologies for efficient and resilient sea-land logistics

    Digital technologies for efficient and resilient sea-land logistics

    The World Ports Tracker in TOC Europe

    The World Ports Tracker in TOC Europe

    Newly-upgraded IAPH World Ports Tracker identifies major sustainability and market trends

    Newly-upgraded IAPH World Ports Tracker identifies major sustainability and market trends

  • Noticeboard
    PhD posts in the area of ports and energy transition

    PhD posts in the area of ports and energy transition

    PortEconomics members among best-performing scholars globally

    PortEconomics members among best-performing scholars globally

    Accessibility or connectivity: why is it correct to say that in the Caribbean the main logistics problem is connectivity?

    Accessibility or connectivity: why is it correct to say that in the Caribbean the main logistics problem is connectivity?

    Cruise Port-City Compass

    Cruise Port-City Compass

    Webinar: short sea shipping services in the southern Caribbean region

    Webinar: short sea shipping services in the southern Caribbean region

  • Viewpoints
    Portgraphic: fleet capacity (owned/chartered) of container shipping lines

    Portgraphic: fleet capacity (owned/chartered) of container shipping lines

    In a tight spot: American ports in global supply chains

    In a tight spot: American ports in global supply chains

    Cruise industry in 2025 at a glance

    Cruise industry in 2025 at a glance

    The box that makes the world go around: container terminals and global trade

    The box that makes the world go around: container terminals and global trade

    Antwerp-Bruges surpasses Rotterdam in Q1 2025: a structural shift or short-term fluctuation?

    Antwerp-Bruges surpasses Rotterdam in Q1 2025: a structural shift or short-term fluctuation?

  • PortLibrary
  • PortReport
Traffic decline in container ports: the exception or the new normal?Containers

Traffic decline in container ports: the exception or the new normal?

August 21st, 2015 Containers, Featured, Viewpoints

READ ALSO

Portgraphic: fleet capacity (owned/chartered) of container shipping lines
Evaluating customer satisfaction with clearing and forwarding agents:  Kuwait Shuwaikh Port
Evaluating customer satisfaction with clearing and forwarding agents: Kuwait Shuwaikh Port
Stakeholders’ attitudes toward container terminal automation
Portgraphic: fleet capacity (owned/chartered) of container shipping lines

By Theo Notteboom

Recently, Hamburg announced that container throughput in the Elbe port saw a decline of 6.8% in the first half of 2015 compared to the same period last year, mainly caused by a sharp decrease in the trade volumes with Russia and China. The container business is generally considered as a growth sector. Over the past decades, ports around the world have become used to welcoming traffic growth year after year. A decline in container traffic is considered as unusual. But how often have ports reported cargo losses over the past decades?

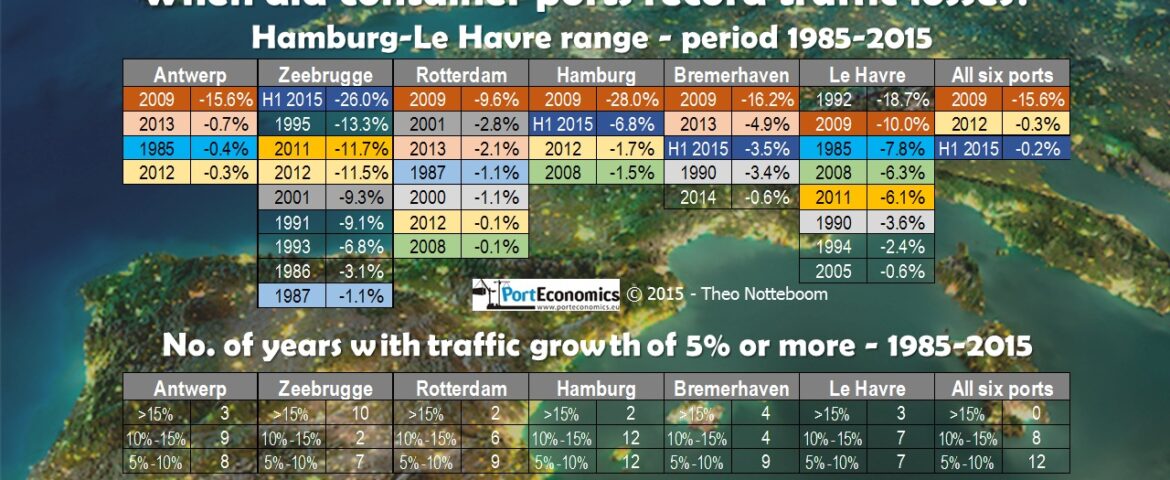
The top graph shows the situation for some of the main container ports in North Europe for a 30-year period between 1985 and the first half of 2015. In nearly all ports the crisis year 2009 ends at the top of the list when it comes to the largest traffic losses ever recorded in one year. In Le Havre, only 1992 brought a bigger volume drop. The outlier was Zeebrugge with a healthy growth of 5.4% in 2009. Four out of six ports saw a container throughput decline in 2012, while 2008 and 2013 turned out negative for half of the container load centres. The growth figures in the first half of 2015 point to traffic losses in Hamburg, Bremerhaven and especially Zeebrugge. Le Havre stays status quo (+0.8%), while Rotterdam (+3.7%) and particularly Antwerp (+9.5%) are reporting healthy growth figures. If the second half of the year would not bring any major changes then 2015 will become a year with the third lowest annual growth rate for the Hamburg-Le Havre range as a whole. Only 2009 and 2012 proved to be even poorer.

In the past thirty years, the Belgian coastal port of Zeebrugge had to deal the most with a reduction of container flows, i.e. 9 times. At the same time it is a port with some of the highest annual growth rates: 19.8% in 1998, 20.5% in 1989, 22.2% in 2007, 24.3% in 1994 and even 72.9% in 1992. The bottom table shows that in 10 of the 30 years growth figures were in excess of 15%, pointing to the highest traffic volatility of all load centres considered. Le Havre is in a somewhat similar situation (8 years with cargo losses) but percentages in the growth years are overall lower than in Zeebrugge. Antwerp and Hamburg saw a volume drop in only four of the 30 years. For the Scheldt port only 2009 represented a serious traffic decline. For the Elbe port all four cases relate to the period after 2008. Rotterdam faced minor volume losses in six of the 30 years, counterbalanced by eight years with more than 10% growth. Only 2009 meant a major setback for the Dutch mainport.

Traffic volatility in individual ports is likely to increase in the coming years. First there is the general economic situation which still does not point to a healthy and sustained growth path for container flows. Second, China – the engine behind the global containerisation boom of the 2000s – shows clear signs of entering a phase of more moderate growth, while Brazil and Russia have had wide-ranging impacts on container volumes over the past ten years. Next, there is the impact of the changes in the alliance formation among carriers which tends to add to the observed volatility (strategic alliances inforgraphic). Then there is the competition for transhipment cargo which can seriously affect the annual results. The commercial rivalry among ports is likely to further intensify as a result of the large-scale capacity additions in Rotterdam (Maasvlakte 2), the arrival of JadeWeserPort and London Gateway on the container scene and the growing competition coming from Baltic ports such as Gdansk and Med ports. And finally, the combination of scale increases in vessel size and less services on the Europe-Far East trade leads to larger call sizes. When one weekly service switches from one port to another, the annual container throughput in both ports can be seriously affected (call sizes infographic infographic). The future will most likely bring more years with volume drops in a number of individual ports, but also more years with exceptionally high growth figures in Europe’s container ports.

Next article 13th Port Performance Research Network (PPRN) meeting
Previous article Growing up fast: brazilian ports

Theo Notteboom

Dr. Theo Notteboom is co-founder and co-director of PortEconomics. He is a professor in port and maritime economics and management with about 25 years of experience in this area. His work is widely cited. He is a regular speaker at international conferences and a rapporteur/expert to leading organizations in the field. He is Chair Professor at Ghent University in Belgium. He is a visiting Research Professor at China Institute of FTZ Supply Chain of Shanghai Maritime University. He also is part-time Professor at University of Antwerp and the Antwerp Maritime Academy in Belgium. He previously held a full-time position as High-end Foreign Expert / Professor at Dalian Maritime University in China (2014-2016) and an MPA visiting professorship in port management at Nanyang Technological University (NTU) in Singapore. He is immediate past President (2010-2014) and Council Member of International Association of Maritime Economists (IAME). Between October 2006 and October 2014 he was President of ITMMA of the University of Antwerp. Between 2009 and 2014 he was Chairman of the Board of Directors of Belgian Institute of Transport Organizers (BITO), an institute of the Belgian Federal Government.

Related Posts

Portgraphic: fleet capacity (owned/chartered) of container shipping lines Containers

Portgraphic: fleet capacity (owned/chartered) of container shipping lines

Investments and financing challenges of the EU’s port managing bodies; findings from a comprehensive survey European Port Policy

Investments and financing challenges of the EU’s port managing bodies; findings from a comprehensive survey

Port reform: World Bank publishes the third edition of its port reform toolkit European Port Policy

Port reform: World Bank publishes the third edition of its port reform toolkit

Weekly Timeline
Sep 18th 3:40 PM
Thematic Area

Portgraphic: fleet capacity (owned/chartered) of container shipping lines

Sep 12th 3:48 PM
Thematic Area

Investments and financing challenges of the EU’s port managing bodies; findings from a comprehensive survey

Aug 12th 2:18 PM
Thematic Area

Port reform: World Bank publishes the third edition of its port reform toolkit

Jul 21st 11:51 AM
Thematic Area

Evaluating customer satisfaction with clearing and forwarding agents: Kuwait Shuwaikh Port

Jul 11th 1:40 PM
Category

When will we admit that maritime transport will not be decarbonised by 2050?

Tweets by @PortEconomics
  • Containers
  • Cruise
  • EPP
  • Ports & COVID-19
  • Back to top
About PortEconomics

PortEconomics is a web-based initiative aiming to advance knowledge exchange on seaport studies. Established by maritime economists affiliated to academic institutions in Belgium, Greece and the Netherlands. It provides freely accessible research, education, information, and network-building material on critical issues of port economics, management and policies.

Additional Information
  • About
  • Login
  • Register
  • Edit Profile
  • Contact us
  • PortProfessionals
  • PortReport Series
  • Terms and Conditions
  • Cookie Policy
© PortEconomics 2025. All rights reserved.
Produced by PortEconomics
Manage Consent
To provide the best experiences, we use technologies like cookies to store and/or access device information. Consenting to these technologies will allow us to process data such as browsing behavior or unique IDs on this site. Not consenting or withdrawing consent, may adversely affect certain features and functions.
Functional Always active
The technical storage or access is strictly necessary for the legitimate purpose of enabling the use of a specific service explicitly requested by the subscriber or user, or for the sole purpose of carrying out the transmission of a communication over an electronic communications network.
Preferences
The technical storage or access is necessary for the legitimate purpose of storing preferences that are not requested by the subscriber or user.
Statistics
The technical storage or access that is used exclusively for statistical purposes. The technical storage or access that is used exclusively for anonymous statistical purposes. Without a subpoena, voluntary compliance on the part of your Internet Service Provider, or additional records from a third party, information stored or retrieved for this purpose alone cannot usually be used to identify you.
Marketing
The technical storage or access is required to create user profiles to send advertising, or to track the user on a website or across several websites for similar marketing purposes.
Manage options Manage services Manage {vendor_count} vendors Read more about these purposes
View preferences
{title} {title} {title}